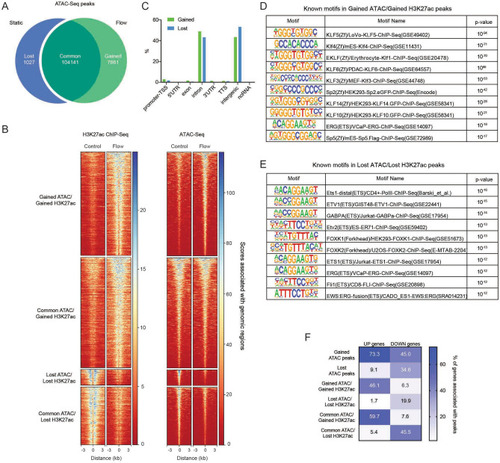
ATAC-Seq identifies DNA motifs that associate with shear stress responsive enhancers. (A) Number of ATAC-Seq peaks specific for HUVEC under static conditions (“lost” after shear stress) or exposed to shear stress (“gained” after shear stress), as well as “common” for both conditions. (B) Heatmap representing scores associated with genomic regions centered on the indicated H3K27ac- and ATAC-Seq peaks in control and flow (18 dyn/cm2 shear stress for 6 h) conditions. (C) Annotation of gained and lost ATAC-Seq peaks that overlap with gained and lost H3K27ac ChIP-Seq peaks, respectively, to defined regions of the genome. (D,E) Analysis of known DNA motifs enriched in gained (D) or lost (E) ATAC-Seq peaks that overlap with gained or lost H3K27ac ChIP-Seq peaks, respectively. The 10 most enriched motifs are shown. (F) Heatmap representing spatial association of genes up- or down-regulated by shear stress with different subsets of ATAC-Seq peaks (all gained and lost ATAC-Seq peaks, gained and lost ATAC-Seq peaks that overlap with gained or lost H3K27ac ChIP-Seq peaks, respectively, or common ATAC-Seq peaks that overlap with gained or lost H3K27ac ChIP-Seq peaks). The numbers represent the percentage of up-or down-regulated genes, associated with at least one peak.
|
