
Fig 5
- ID
- ZDB-FIG-220325-23
- Publication
- Lu et al., 2022 - mTOR activity is essential for retinal pigment epithelium regeneration in zebrafish
- Other Figures
- All Figure Page
- Back to All Figure Page
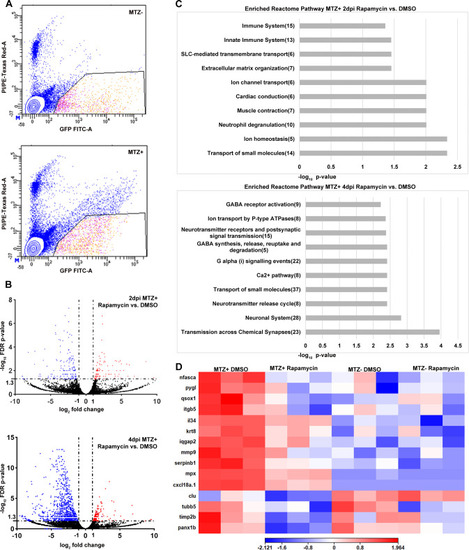
(A) Representative FACS plots from MTZ- and MTZ+ samples to show gating parameters used to isolate GFP+ PI- RPE cells (B) Volcano plots showing differentially expressed genes between MTZ+ rapamycin-treated and DMSO-treated groups at 2dpi and 4dpi. Dashed lines indicate the threshold criteria. Each dot represents an individual gene; red dots represent significantly upregulated DEGs, blue dots represent significantly downregulated DEGs, and black dots represent non-significant genes. (C) Pathway enrichment analysis on the significantly downregulated 2dpi and 4dpi DEGs. Numbers in parentheses are the gene counts enriched in each pathway. (D) Hierarchical clustering heatmap of the 15 genes enriched in the 2dpi immune system Reactome pathway across all four experimental groups showing these immune related genes are downregulated by rapamycin treatment. Heatmap legend represents log10 (counts per million mapped reads; CPM). |