
Figure 8
- ID
- ZDB-FIG-220309-19
- Publication
- Banerjee et al., 2022 - Vision and sensorimotor defects associated with loss of Vps11 function in a zebrafish model of genetic leukoencephalopathy
- Other Figures
- All Figure Page
- Back to All Figure Page
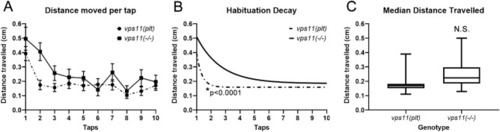
vps11(plt) and vps11(−/−) mutants show different rates of habituation response to multiple high intensity acoustic/tap stimuli. (A) Graph representing average distance moved by vps11(plt) (dashed line; n = 64) and vps11(−/−) (solid line; n = 44) larvae at each individual tap stimuli. B. First order exponential decay curve representing average distance travelled by vps11(plt) (dashed line; n = 64) and vps11(−/−) (solid line; n = 44) larvae at each individual tap stimuli *P < 0.0001. (C) Box-plots representing the average distance travelled by vps11(plt) (n = 64) and vps11(−/−) (n = 44) larvae at all 10 tap stimuli. Error bars indicate SEM. |
| Fish: | |
|---|---|
| Condition: | |
| Observed In: | |
| Stage: | Days 7-13 |