
FIGURE
Fig. 2
- ID
- ZDB-FIG-220305-24
- Publication
- Hoque et al., 2021 - Adaptation to an amoeba host drives selection of virulence-associated traits in Vibrio cholerae
- Other Figures
- All Figure Page
- Back to All Figure Page
Fig. 2
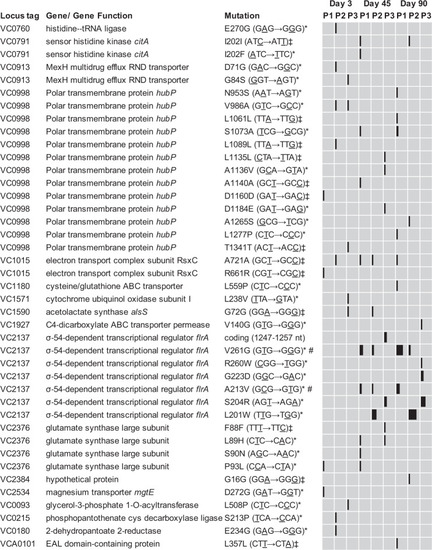
The locus tag and name of the affected gene are indicated in the first and second columns, respectively. The third column shows the amino acid change and its position in the protein with the affected nucleotide responsible for the amino acid change underscored in the parentheses. The black horizontal bars of the heatmap represent the frequency of respective mutations found in each population (P1, P2, P3) with value ranges from 10 to 100%. The symbols represent as follows *non-synonymous mutation, ‡synonymous mutation, # same mutation also found in single clone at 100% frequencies. |
Expression Data
Expression Detail
Antibody Labeling
Phenotype Data
Phenotype Detail
Acknowledgments
This image is the copyrighted work of the attributed author or publisher, and
ZFIN has permission only to display this image to its users.
Additional permissions should be obtained from the applicable author or publisher of the image.
Full text @ ISME J.