
FIGURE 4
- ID
- ZDB-FIG-220305-13
- Publication
- Huang et al., 2022 - An In Vivo Fluorescence Resonance Energy Transfer-Based Imaging Platform for Targeted Drug Discovery and Cancer Therapy
- Other Figures
- All Figure Page
- Back to All Figure Page
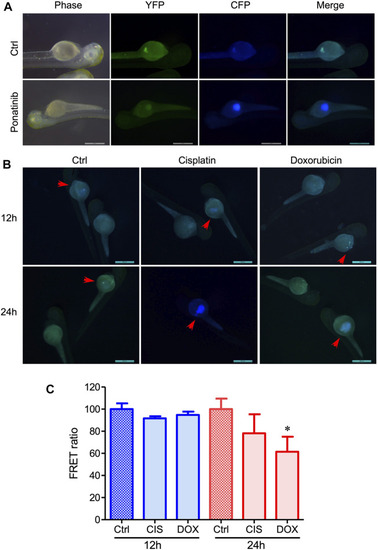
Evaluation of the in vivo drug-induced cell apoptosis in xenograft zebrafish by injecting 231-C3 cells into the zebrafish embryos. (A) Fluorescent images of zebrafish injected with 231-C3 cells and incubated with Ponatinib (10 μM) for 24 h. (B) Images of cell apoptosis in 231-C3 labeled zebrafish after 30 μM cisplatin or 2 μM DOX treatment. Arrows indicate the same zebrafishes observed at different time points. Scale bar = 500 μm. (C) Quantification of FRET ratio in zebrafish after 30 μM cisplatin or 2 μM DOX treatment. n = 6 technical replicates. Data are expressed as mean ± s.e.m. n = 7. *p < 0.05, by Student’s t-test. |