
FIGURE 3
- ID
- ZDB-FIG-220305-12
- Publication
- Huang et al., 2022 - An In Vivo Fluorescence Resonance Energy Transfer-Based Imaging Platform for Targeted Drug Discovery and Cancer Therapy
- Other Figures
- All Figure Page
- Back to All Figure Page
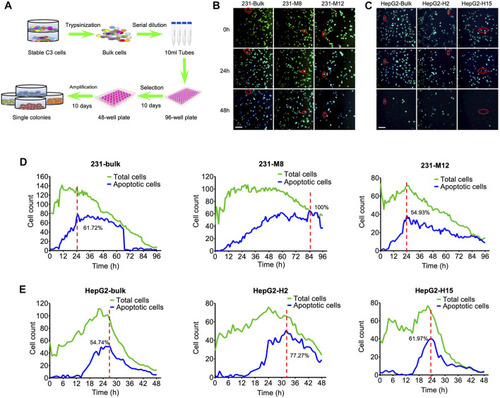
Tipping points of apoptosis in C3 cells during drug treatment. (A) The flow chart for the selection of single-cell colonies from bulk C3 cells. Single cell clones were harvested from bulk cells by serial dilution in 96-well plate and amplification in 48-well plate. (B) Images of DOX-induced cell apoptosis in single-cell colonies of MDA-MB-231-C3 cells. Red circle indicates single-cell imaging of cell apoptosis. (C) Images of DOX-induced cell apoptosis in single-cell colonies of HepG2-C3 cells. Red circle indicates single-cell imaging of cell apoptosis. (D) Time courses of DOX-induced cell apoptosis of single-cell colonies in MDA-MB-231-C3 cells. (E) Time courses of DOX-induced cell apoptosis of single-cell colonies in HepG2-C3 cells. Green and blue lines indicate total and apoptotic cells, respectively. Scale bar = 50 µm. |