
FIGURE
Figure 3
- ID
- ZDB-FIG-220302-95
- Publication
- Bashirzade et al., 2022 - MPTP-Treated Zebrafish Recapitulate 'Late-Stage' Parkinson's-like Cognitive Decline
- Other Figures
- All Figure Page
- Back to All Figure Page
Figure 3
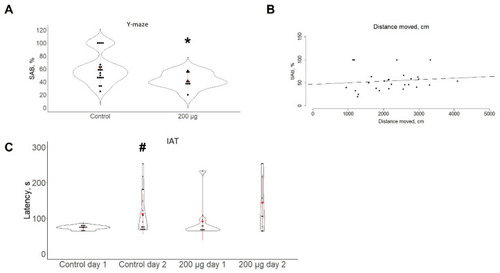
Analysis of cognitive functions in adult zebrafish in the aquatic Y-maze test (panel (A), assessed as % of spontaneous alternation behavior, SAB, n = 9–19 per group, analyzed using the unpaired two-sample t-test and Pearson correlation (Panel (B)) and the inhibitory avoidance test (IAT, n = 9–19 per group, panel (C), analyzed using paired sample t-test). Data are presented as the violin and dot plots. Red dots with lines represent mean ± SD; * p < 0.05 vs. control fish, unpaired two-sample t-test, # p < 0.05 vs. control day 1, paired t-test. |
Expression Data
Expression Detail
Antibody Labeling
Phenotype Data
| Fish: | |
|---|---|
| Condition: | |
| Observed In: | |
| Stage: | Adult |
Phenotype Detail
Acknowledgments
This image is the copyrighted work of the attributed author or publisher, and
ZFIN has permission only to display this image to its users.
Additional permissions should be obtained from the applicable author or publisher of the image.
Full text @ Toxics