
Figure 7
- ID
- ZDB-FIG-220219-28
- Publication
- Papenfuss et al., 2022 - Differential maturation and chaperone dependence of the paralogous protein kinases DYRK1A and DYRK1B
- Other Figures
- All Figure Page
- Back to All Figure Page
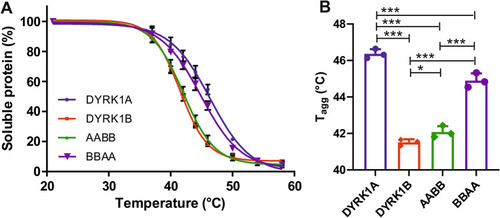
CETSA melt curves of wild type and chimeric DYRK1 constructs. Intact HEK293 cells with stable overexpression of the indicated HiBiT-tagged DYRK constructs were incubated for 3.5 min at variable temperatures. After freeze–thaw lysis, samples were centrifuged and the amount of DYRK constructs in the soluble fraction was measured using the HiBiT lytic assay. The graphs represent the means and SD of 3 independent experiments. ( |