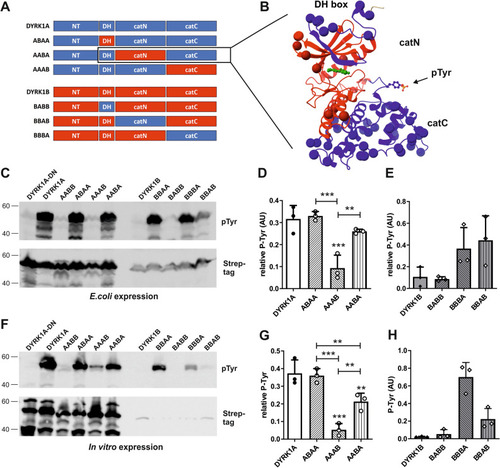
Effects of N-lobe or C-lobe substitution on tyrosine autophosphorylation. (A) Schematic representation of the chimeras. The N-terminal and the C-terminal parts of the catalytic domain are designated catN and catC. Information on the amino acid positions of the different parts can be found in the Supplementary information. (B) Exemplary representation of the chimeric kinase domain in the AABA construct. The ribbon diagram is based on the structure of a DYRK1A-inhibitor co-crystal (4YLJ52). The DH box and catC are shown in blue and the catN part is shown in red. CatN comprises the ATP binding pocket (illustrated by the ball and stick representation of the inhibitor in green) and the catalytic cleft. Spheres indicate the position of amino acids that differ between DYRK1A and DYRK1B. The activation loop with the autophosphorylated tyrosine (pTyr) is identical in DYRK1A and DYRK1B. (C–E) Bacterial expression. Tyrosine autophosphorylation of the indicated constructs was analyzed by immunoblotting. The graphs show the quantitative results for the chimeric DYRK1A constructs containing segments of DYRK1B (D) and the chimeric DYRK1B constructs containing segments of DYRK1A (E) (means and SD, n = 3). Quantitation of AABB and BBAA was included in Fig. 4. Unless otherwise indicated, statistical significance is given for the comparison with the wild type constructs. (F–H) Cell-free expression. The DYRK1A-DYRK1B chimeric constructs were expressed by in vitro translation for 2 h at 37 °C. Panel G shows the relative tyrosine autophosphorylation of the DYRK1A chimeric constructs (means and SD, n = 3). Because of low Strep-tag signal intensities, relative autophosphorylation of DYRK1B constructs could not be calculated. Absolute phosphotyrosine signals are shown in panel H (means and SD, n = 3).
|
