
Figure 4
- ID
- ZDB-FIG-220219-113
- Publication
- Sanchez-Gonzalez et al., 2022 - Innate Immune Pathways Promote Oligodendrocyte Progenitor Cell Recruitment to the Injury Site in Adult Zebrafish Brain
- Other Figures
- All Figure Page
- Back to All Figure Page
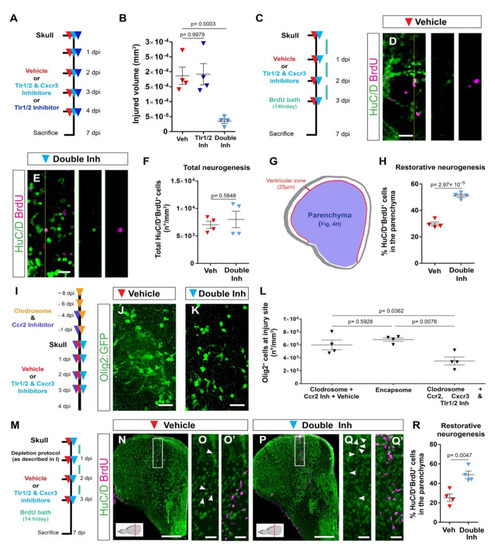
Activation of Tlr1/2 and Cxcr3 creates a detrimental environment by inducing oligodendroglia accumulation in a microglia/monocyte-independent manner. (A) Scheme of the experimental design to analyze the consequences of double-inhibitor treatment (NBI 74330 and CU CPT22). (B) Graph illustrating the size of the injured volume 7 days after skull injury and vehicle, Tlr1/2 inhibitor (CU CPT22), or double Tlr1/2 and Cxcr3 inhibitor (NBI 74330 and CU CPT22) treatment. p-values are based on a one-way ANOVA (p-value = 1.971 × 10⁻⁴) with a post-hoc Dunnett test (Many-to-One). (C) Experimental scheme designed to study restorative neurogenesis upon different treatments. (D,E) Images depicting HuC/D+ and BrdU+ cells located in the parenchyma following vehicle (D) and double-inhibitor (E) treatment. (F) Dot-plot showing the total density (whole telencephalon) of HuC/D+ and BrdU+ after vehicle and Tlr1/2 and Cxcr3 inhibitor treatment. p-value is based on WelcH′s t-test with unequal variances. (G) Diagram illustrating the ventricular zone (25 µm from the ventricle surface) and the parenchyma (blue area) in the telencephalic region. Restorative neurogenesis was measured by the proportion of newly generated neurons (HuC/D+ and BrdU+) that migrated towards the parenchyma with respect to the total number (ventricular zone and parenchyma) of new neurons. (H) Graph depicting the proportion of HuC/D+ and BrdU+ cells located in the telencephalic parenchyma after vehicle and Tlr1/2 and Cxcr3 inhibitor treatment. p-value is based on Student’s t-test with equal variances. (I) Design of the experimental workflow to analyze the effect of Tlr1/2 and Cxcr3 inhibitors on accumulation of Olig2:GFP+ cells after microglia/monocytes depletion. (J,K) Micrographs depicting the reactivity of Olig2:GFP+ cells after skull injury at 4 dpi with microglia/monocyte depletion and vehicle (J) or Tlr1/2 and Cxcr3 inhibitor treatments (K). (L) Graph illustrating the density of Olig2:GFP+ cells at the injury site at 4 dpi following Clodrosome + Ccr2 (MK-0812) inhibitor treatment (microglia/monocyte depletion protocol), Encapsome (empty liposomes, control for Clodrosome; ventricular injection) and Clodrosome + Ccr2 + Tlr1/2 (CU CPT22) + Cxcr3 (NBI 74330) inhibitor treatments. The decrease in Olig2:GFP+ cell accumulation after Tlr1/2 and Cxcr3 inhibitor treatment was maintained in microglia/monocyte-depleted brain. p-values are based on a one-way ANOVA (p-value = 7.957 × 10⁻³) with a post-hoc Tukey Test (All Pairs). (M) Design of the experimental protocol used to analyze injury-induced neurogenesis (BrdU-based birth dating) in microglia/monocyte-depleted brains treated with vehicle or Tlr1/2 and Cxcr3 inhibitor cocktail. (N,P) Micrographs of injured telencephala at 7 dpi showing the generation of new neurons (HuC/D+/BrdU+) after vehicle (N) and Tlr1/2 and Cxcr3 inhibitor (P) treatment in microglia/monocyte-depleted brains. (O,O′,Q,Q′) are magnifications of the areas boxed in (N,P), respectively. White arrowheads depict double HuC/D+ and BrdU+ cells. The level of the cross-section is indicated in the inset. (R) Graph depicting the proportion of HuC/D+ and BrdU+ cells located in the telencephalic parenchyma after vehicle and Tlr1/2 and Cxcr3 inhibitor treatment. p-value is based on Student’s t-test with equal variances. All images are full z-projections of a confocal stack. Data are shown as mean ± SEM; each data point represents one animal. Scale bars in (N,P) = 100 μm; scale bars in (D,E,J,K,O,O′,Q,Q′) = 20 μm. Abbreviations: dpi: days post-injury; Veh: vehicle; Inh: inhibitors. Symbol description: red triangle: vehicle; dark blue triangle: Tlr1/2 inhibitor, CU CPT22; light blue triangle: double inhibitors, NBI 74330 and CU CPT22; orange triangle: ventricular Clodrosome injection; purple triangle: intraperitoneal Ccr2 inhibitor injection, MK-0812. |