FIGURE

Fig. 2

ID
ZDB-FIG-220215-2
Publication
Chernyavskaya et al., 2022 - Long-read sequencing of the zebrafish genome reorganizes genomic architecture
Other Figures
All Figure Page
Back to All Figure Page
Fig. 2

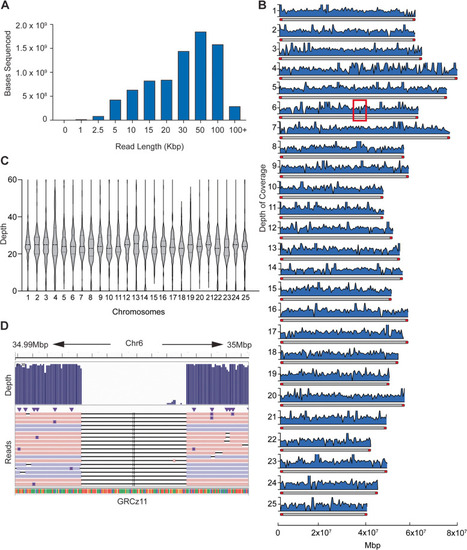
Long-read library run metrics. A Distribution of read lengths from one representative library (L194) relative to number of bases sequenced within that library. Read length distribution for additional libraries can be found in Supplemental Fig. 1. B Histogram of read depth and coverage across individual chromosomes at 50Kbp intervals. Chromosomes are depicted on the y-axis with maximum depth cut off at 50X. Telomeres (red caps) extend the first 20Kbp into each chromosome. Red box on Chr 6 emphasizes a region of low coverage. C Cumulative average depth across all chromosomes of long-read assembly. D Magnification of low coverage region depicted in B (red box) to show continuous nanopore reads spanning across the zero-coverage section of GRCz11

Expression Data

Expression Detail
Antibody Labeling
Phenotype Data

Phenotype Detail
Acknowledgments
This image is the copyrighted work of the attributed author or publisher, and ZFIN has permission only to display this image to its users. Additional permissions should be obtained from the applicable author or publisher of the image. Full text @ BMC Genomics