FIGURE

Figure 6.

ID
ZDB-FIG-220214-37
Publication
Minnoye et al., 2020 - Cross-species analysis of enhancer logic using deep learning
Other Figures
All Figure Page
Back to All Figure Page
Figure 6.

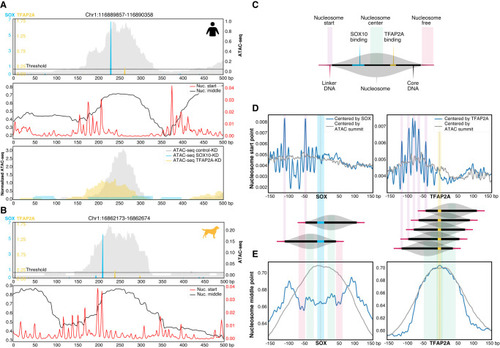
Positional specificity of SOX10 and TFAP2A in MEL melanoma enhancers. (A,B, top) Example human (A) and dog (B) MEL-predicted enhancer containing significant SOX10 and TFAP2A motifs. The ATAC-seq signal is shown in gray. (A, middle; B, bottom) Imputed nucleosome start and middle point profiles. (A, bottom) For the human example region, ATAC-seq profiles of MM001 in control condition, after 72 h of SOX10 knockdown or TFAP2A knockdown are shown. (C) Schematic overview of the nucleosome structure explaining the colors used in D and E. (D,E) Nucleosome start point (D) and nucleosome middle point predictions (E) on MEL-predicted regions containing one SOX10 (left) or one TFAP2A motif (right) next to possible other motifs, where the regions are either centered on the ATAC-seq summit (gray) or on the SOX10 or TFAP2A motif (blue).

Expression Data

Expression Detail
Antibody Labeling
Phenotype Data

Phenotype Detail
Acknowledgments
This image is the copyrighted work of the attributed author or publisher, and ZFIN has permission only to display this image to its users. Additional permissions should be obtained from the applicable author or publisher of the image. Full text @ Genome Res.