
Fig. 2.
- ID
- ZDB-FIG-220205-43
- Publication
- Barthelson et al., 2021 - Brain transcriptomes of zebrafish and mouse Alzheimer's disease knock-in models imply early disrupted energy metabolism
- Other Figures
- All Figure Page
- Back to All Figure Page
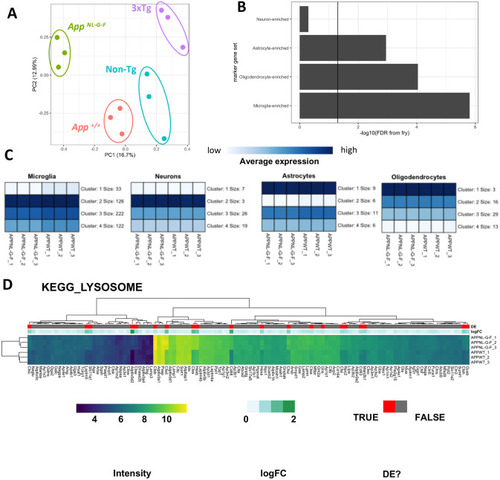
Microarray analysis of male 12-month-old homozygous AppNL-G-F mice. (A) Principal component analysis of brain transcriptome data from male 12-month-old homozygous AppNL-G-F (n=3), 3xTg (n=3), App wild-type (App+/+, n=3) and non-transgenic (non-Tg, n=3) mice. The numbers in parentheses indicate the percentage of variation in the dataset explained by a principal component. Each point represents a sample, which are coloured by genotype. (B) Bar chart showing the FDR-adjusted P-value (directional hypothesis) from fry on marker genes of neurons, oligodendrocytes, astrocytes and microglia in AppNL-G-F relative to wild type. (C) Heatmaps indicating the expression (intensity) of genes within these marker gene sets summarised using K-means (K=4). (D) Heatmap showing the expression of genes in the KEGG_LYSOSOME gene set, clustered by their Euclidean distance. Each gene is labelled in red if they were identified as differentially expressed (DE), and the magnitude of the fold change (logFC) is shown in green. |