
FIGURE
Fig. 4
Fig. 4
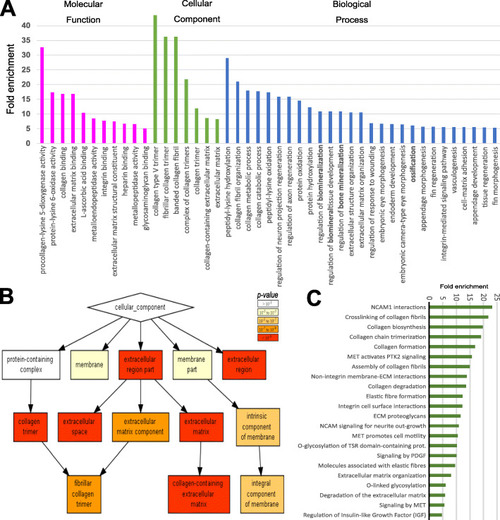
Gene ontology and pathway analysis. A Panther gene ontology (GO) analysis showing high enrichment (> 5 fold) of collagen, ossification, and ECM related terms. B GOrilla software showing cellular component hierarchical clustering of collagen-related GO terms. C) Graphical representation of enrichment (> 5 fold) of differentially expressed gene set using Panther Reactome Pathway overrepresentation test (v65) that showed enrichment of cell adhesion, collagen matrix and processing and glycosylation terms |
Expression Data
Expression Detail
Antibody Labeling
Phenotype Data
Phenotype Detail
Acknowledgments
This image is the copyrighted work of the attributed author or publisher, and
ZFIN has permission only to display this image to its users.
Additional permissions should be obtained from the applicable author or publisher of the image.
Full text @ BMC Biol.