
FIGURE
Figure 5
Figure 5
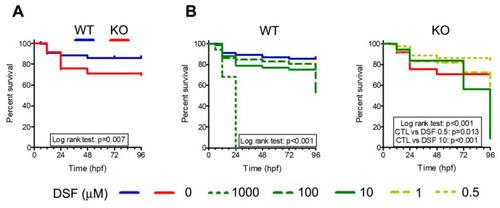
Effect of DSF on survival in wild-type (WT) and cystinotic (KO) zebrafish embryos and larvae. (A) Survival curves of untreated KO (n = 82) and WT (n = 126) embryos and larvae. (B) Survival curves of WT and KO embryos treated with different DSF concentrations as indicated in the figure legend. All curves are obtained from at least 100 larvae. Survival was monitored for 96 h post-fertilization (hpf). |
Expression Data
Expression Detail
Antibody Labeling
Phenotype Data
| Fish: | |
|---|---|
| Condition: | |
| Observed In: | |
| Stage Range: | Prim-5 to Day 4 |
Phenotype Detail
Acknowledgments
This image is the copyrighted work of the attributed author or publisher, and
ZFIN has permission only to display this image to its users.
Additional permissions should be obtained from the applicable author or publisher of the image.
Full text @ Cells