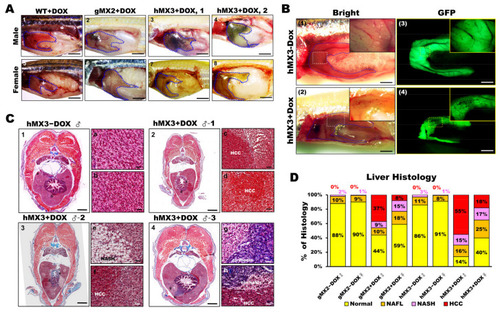
Male hMX3 zebrafish progress NAHCC at 10 mpf. (A) Gross liver of WT ± Dox, gMX2 ± Dox, and hMX3 ± Dox male (panels 1–4), and female (panels 5–8) zebrafish at 10 mpf. Scale bar: 3 mm. The livers are circled. Scale bar: 3 mm. (B) Angiogenesis and disruption of vascular architecture linked to HCC progression in the livers of hMX3 using bright field microscopy: (1) hMX3 − Dox and (2) hMX3 + Dox with corresponding GFP fluorescence images (3) hMX3 − Dox and (4) hMX3 + Dox. Scale bar: 3 mm. (C) Masson’s trichrome stained livers of male zebrafish (1) hMX3 − Dox indicative of normal liver, (2) hMX3 + Dox 1 (sample 1), (3) hMX3 + Dox 2, and (4) hMX3 + Dox 3. Scale bar: 2 mm. Insets: images of normal liver (panels a and b), HCC (panels c and d), steatohepatitis concomitant with HCC (panels e and f), and hMX3 + Dox 3 advanced fibrosis (cirrhosis) concomitant with HCC (panels g and h). Scale bar: 50 μm. (D) Percentage of histological features of liver sections from different experimental groups (n = 5−10). Masson’s trichrome staining results are shown as the percentages of fish displaying normal characteristics (yellow), steatosis (orange), NASH (pink), and HCC (red).
|
