
Figure 2
- ID
- ZDB-FIG-211223-32
- Publication
- Bolton et al., 2021 - Rhythmic Clock Gene Expression in Atlantic Salmon Parr Brain
- Other Figures
- All Figure Page
- Back to All Figure Page
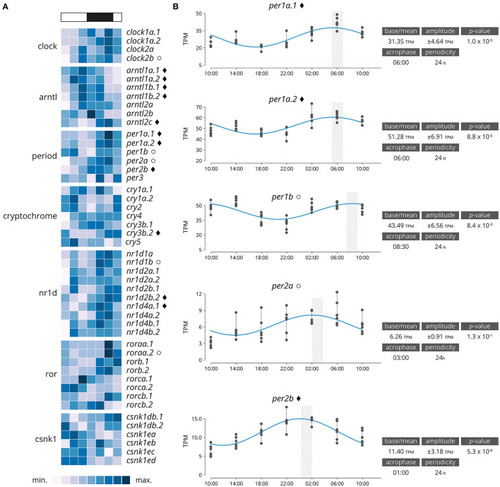
(A) Heatmap displaying average diel expression of identified clock genes under constant LD (12:12, n = 6 per time point). The heatmap of the relative expression of each individual gene [scaled from lowest expression to highest expression]. Black diamond indicates significantly cyclic gene (p < 0.001) [JTK and RAIN analysis], White circles denote rhythmic genes (p < 0.001) [RAIN analysis]. (B) Significantly clock gene expression. Parameters of the cyclic sin-cosine function calculated by MetaCycle with JTK for diel expression of clock genes in brains collected from Atlantic salmon smolt exposed to an LD 12:12 photoperiod. |