
Figure 4
- ID
- ZDB-FIG-211129-88
- Publication
- Bhatia et al., 2021 - Quantitative spatial and temporal assessment of regulatory element activity in zebrafish
- Other Figures
- All Figure Page
- Back to All Figure Page
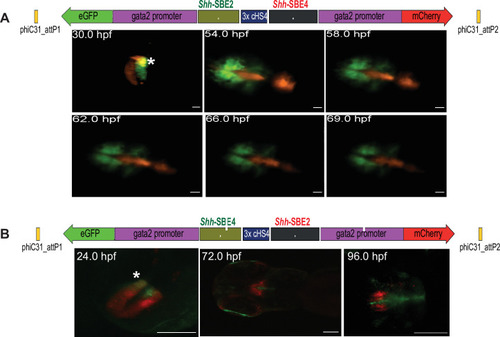
(A) Top: schematic of assay construct with two enhancers from the mouse Shh locus active in developing forebrain (Shh-SBE2 and Shh-SBE4 driving eGFP and mCherry respectively). Below: snapshots of live imaging of F1 embryos derived from transgenic lines bearing the assay construct. Distinct as well as overlapping domains (marked by *) of activities are observed for the two cis-regulatory elements (CREs) in early stages of development, until about 54 hr post fertilisation (hpf). At later stages of embryonic development, the activities of the two forebrain CREs are observed in completely distinct domains. Scale bar = 100 μm. (B) As in (A) but with a dye-swap, that is, Shh-SBE2 driving mCherry and Shh-SBE4 driving eGFP.
|