
Fig. 5
- ID
- ZDB-FIG-211118-68
- Publication
- Matrone et al., 2021 - Nuclear S-nitrosylation impacts tissue regeneration in zebrafish
- Other Figures
- All Figure Page
- Back to All Figure Page
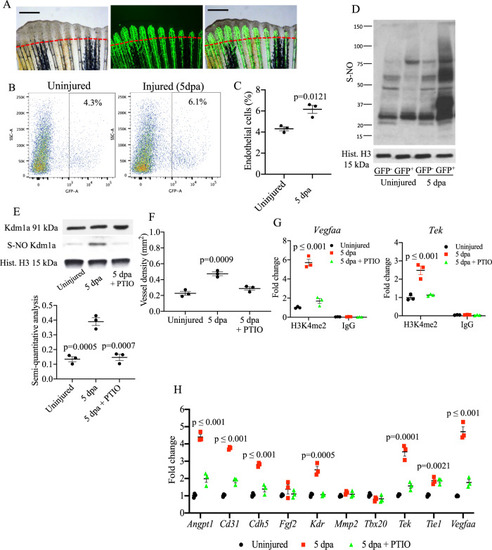
Analysis of S-nitrosylation in endothelial cells during tailfin regeneration.
A Brightfield and fluorescence images of Tg(fli1:EGFP)y1 zebrafish tailfin at 3 days post-amputation (dpa) showing formation of new vessel branches (GFP signal). Scale bar measures 500 μm. B FACS plot of GFP+ and GFP− cells in the tailfin in control and during regeneration were separated by FACS. C Quantification of GFP+ cells as shown in FACS plots. Two-tailed t-test. D Western blotting (WB) of total S-nitrosylated proteins in zebrafish tailfin endothelial (GFP+) cells. E WB of Kdm1a and S-nitrosylated Kdm1a in endothelial (GFP+) cells control, injury and injury + PTIO (NO scavenger) 10 mM. Dot plot shows semi-quantitative analysis. p values vs. 5 dpa group. F Vessel density analysis in Tg(fli1:EGFP)y1 zebrafish tailfin uninjured, injured and injured + PTIO 10 mM, measured as total length of vessels. G ChIP-PCR analysis in GFP+ cells isolated from the regenerating tailfin showing H3K4me2-binding complex with vegfaa and tek promoters. Rabbit IgG were used as a negative control. H Real time PCR analysis for endothelial genes in GFP+ cells from zebrafish control, injury and injury + PTIO 10 mM. Histone H3 was used as loading control. One-way ANOVA followed by Bonferroni’s multiple comparisons test, p values indicate comparisons vs. uninjured. N = 3 biological replicates. Data are presented as mean values +/− SEM. |