
Fig. 5
- ID
- ZDB-FIG-211105-11
- Publication
- Tsedeke et al., 2021 - Cardiomyocyte heterogeneity during zebrafish development and regeneration
- Other Figures
- All Figure Page
- Back to All Figure Page
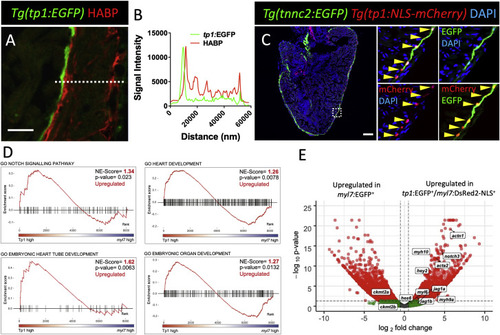
Primordial layer cardiomyocytes display higher Notch signaling and express embryonic cardiomyocyte genes. (A) Sagittal section of a Tg(tp1:EGFP) adult ventricular wall stained for EGFP expression (green) and HABP (red). (B) tp1:EGFP (green line) and HABP (red line) fluorescence intensity measured along the white dotted line in (A). (C) Sagittal section of a Tg(tp1:NLS-mCherry); Tg(tnnc2:EGFP) adult ventricle stained for EGFP expression (green), mCherry expression (red) and DNA (blue). Yellow arrowheads point to tnnc2:EGFP+/tp1:NLS-mCherry+ cells. (D and E) Gene ontology plots (D) from Gene Set Enrichment Analysis (GSEA) and volcano plot (E) comparing tp1:EGFP+/myl7:DsRed2-NLS+ vs myl7:EGFP+ RNA-seq. Scale bars: 10 μm. |
Reprinted from Developmental Biology, 476, Tsedeke, A.T., Allanki, S., Gentile, A., Jimenez-Amilburu, V., Rasouli, S.J., Guenther, S., Lai, S.L., Stainier, D.Y.R., Marín-Juez, R., Cardiomyocyte heterogeneity during zebrafish development and regeneration, 259-271, Copyright (2021) with permission from Elsevier. Full text @ Dev. Biol.