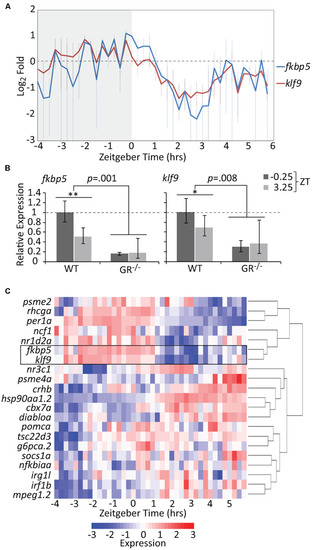
The temporal activities of the GR targets klf9 and fkbp5 are dynamic and synchronous. (A) Average relative levels of klf9 and fkbp5 transcripts in three biological replicates of pooled (n = 3–6) 5 dpf larvae snap-frozen every 15 min from −4 to 6 h zeitgeber time (ZT). Error bars are standard error of the mean of three biological replicates. (B) Relative expression of klf9 and fkbp5 in WT and nr3c1–/– (GR369–, Gans et al., 2020) mutant larvae at −0.25 and +3.25 ZT, time points that, respectively, correspond to the activity peak and nadir of both genes in WT larvae. Error bars represent 95% confidence intervals of three biological replicates of pooled larvae (n = 9 per sample). Significance calculated by two-factor (time and genotype) ANOVA, and one-tailed t-tests to assess the effect of time within each genotype; ∗∗p = 0.01; ∗p = 0.05. (C) Heat map of expression of klf9, fkbp5, and additional targets/regulators of glucocorticoid (GC) signaling as measured on the NanoString platform. Gene panel includes well-known glucocorticoid receptor (GR) targets as well as targets identified by our lab as consistently over-expressed in chronic CORT treated (Gans et al., 2020). Counts data are normalized to reference genes (actb2, rpl13a, and eif5a) and scaled within each gene to normalize for different absolute levels of expression.
|
