|
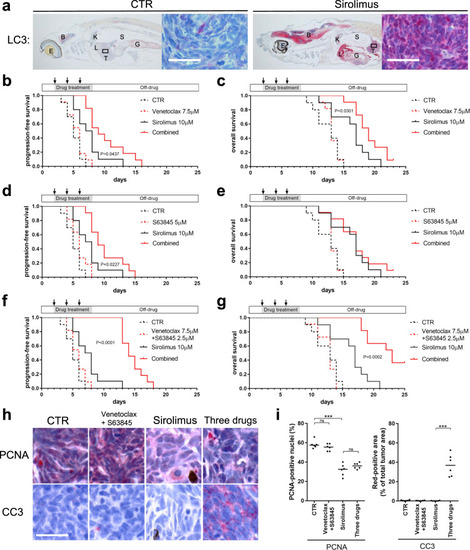
Sirolimus synergizes with venetoclax and S63845 to suppress <italic>nf1/pten</italic>-mutant melanoma tumor growth and extend the survival of tumor-bearing zebrafish.a Representative sagittal tissue sections from a transplanted nf1/pten-mutant melanoma tumor treated for 2 days with the indicated drugs. Sections were immunostained with antibodies to detect LC3A/B. Left panels: E = eye, B = brain, G = gut, K = kidney, L = liver, S = swim bladder, T = tumor. Right panels: ×63 magnification of tumor cells from the small black boxes in left panels. b–g Transplanted nf1/pten-mutant melanoma tumor cells were monitored daily in 3-week-old rag2−/− recipient zebrafish treated with DMSO (CTR), venetoclax, S63845, sirolimus, or the drug combinations (n = 11 or 12 for each curve; doses as indicated). Kaplan–Meier curves for PFS (b, d, and f) and OS (c, e, and g) were compared using a log-rank test. Drugs were refreshed every 2 days during the 6-day course of treatment, as indicated by black arrows. h Representative tissue sections from transplanted nf1/pten-mutant melanoma tumors treated for 2 days with DMSO (CTR), 7.5 μM venetoclax and 2.5 μM S63845, 10 μM sirolimus, and the three-drug combination. Sections were immunostained using antibodies to detect PCNA and CC3 and quantified in (i). ns p > 0.05, ***p < 0.0001 by Mann–Whitney test. Scale bars = 20 μm.
|