
Fig. 4
- ID
- ZDB-FIG-211008-4
- Publication
- Ross et al., 2021 - Generation and Molecular Characterization of Transient tet1/2/3 Zebrafish Knockouts
- Other Figures
- All Figure Page
- Back to All Figure Page
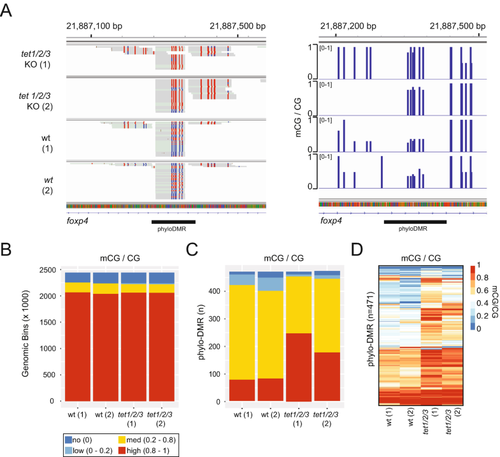
Visualization and analysis of tet1/2/3 KO RRBS data. (a) Left panel: IGV visualization of BAM files in bisulfite mode (CG) over a phylo-DMR (phylotypic stage enhancer) region. Red = methylated cytosine, blue = unmethylated cytosine. Grey boxes represent single reads. Right panel: IGV visualization of BigWig files. Blue bars represent methylation level (mCG/CG). (b) Global mCG/CG levels of two biological replicates of uninjected (wt) and injected (tet1/2/3 KO) 24hpf F0 zebrafish. Methylation values correspond to average mCG/CG level in genomic bins (150 bp). (c) PhyloDMR mCG/CG levels of two biological replicates of uninjected (wt) and injected (tet1/2/3 KO) 24 hpf F0 zebrafish. (d) Heatmap showing locus-specific mCG/CG levels in phyloDMRs |