
Figure 7
- ID
- ZDB-FIG-210927-21
- Publication
- Kim et al., 2021 - A zebrafish screen reveals Renin-angiotensin system inhibitors as neuroprotective via mitochondrial restoration in dopamine neurons
- Other Figures
- All Figure Page
- Back to All Figure Page
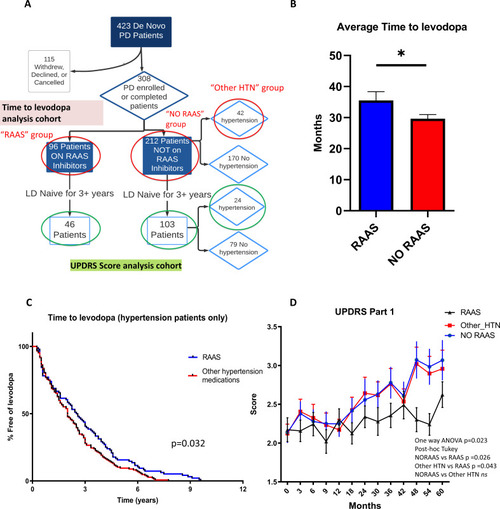
(A) Flow chart showing the patient cohort studied in the PPMI data. Red circles indicate groups of patients on RAAS, not on RAAS, and on other anti-hypertension medications (HTN) used for the time to levodopa analysis. Green circles indicate the patient cohorts not on levodopa for 3+ years that were used for the UPDRS Part 1, 2, and 3 analyses. (B) Average time to levodopa therapy for de novo PD patients shows significant difference in patients taking RAAS inhibitors versus patients not on RAAS inhibitors (n = 96 and 212; p < 0.05, unpaired t-test) (C) Kaplan Meier survival curve showing the percentage of HTN patients free of levodopa over time for those on RAAS inhibitors versus on other anti-hypertensive medications. HTN patients on RAAS inhibitors showed greater percentage free of levodopa over time compared to patients on other HTN medications (n = 96 and 42; p < 0.05, Log-rank Mantel-cox test). (D) UPDRS Score part one shows significantly worsened (higher) scores for subsequent visits in the No RAAS group and the group using other anti-hypertensives compared to the group on RAAS inhibitors (n = 46, 24, and 103; p = 0.023, one-way ANOVA, post-hoc Tukey).
|