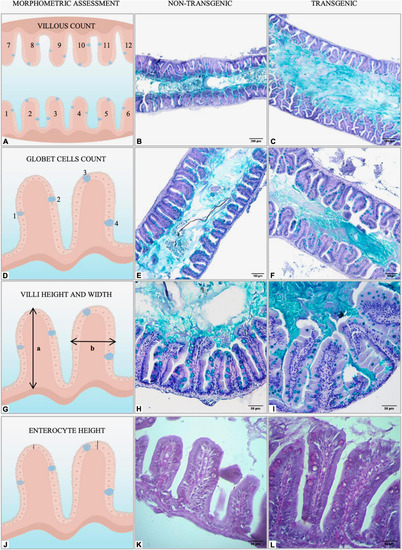
Graphical representation of morphometric analysis performed in the intestine of non-transgenic and gh-transgenic zebrafish (D. rerio) siblings. (A) Intestinal folds were manually counted in six fields randomly sampled for each animal using the multipoint tool from ImageJ. Representative Alcian blue-stained sections of midgut cross-sections from (B) non-transgenic and (C)gh-transgenic zebrafish. Magnification: ×10, scale bar: 200 μm. (D) The number of intestinal goblet cells was determined by manually counting all cells in six randomly sampled fields for each animal using the multipoint tool from ImageJ. Representative images of midgut sections stained for the goblet cell marker Alcian blue from (E) non-transgenic and (F)gh-transgenic zebrafish. Magnification: ×20, scale bar: 100 μm. (G) Intestinal villus height (a) and width (b) were manually measured in the anterior and middle intestine from 24 individual villi randomly sampled for each animal using the segmented line tool from ImageJ. Representative Alcian blue-stained sections of anterior intestine from (H) non-transgenic and (I)gh-transgenic zebrafish. Magnification: ×40, scale bar: 50 μm. (J) Enterocyte height was manually measured in the anterior intestine from 24 individual villi randomly sampled for each animal using the segmented line tool from ImageJ. Representative Periodic acid-Schiff (PAS) stained sections of anterior intestine from (K) non-transgenic and (L)gh-transgenic zebrafish. Magnification: ×40, scale bar: 50 μm, n = 18 non-transgenic and 18 gh-transgenic zebrafish.
|
