
FIGURE
Figure 4
- ID
- ZDB-FIG-210902-99
- Publication
- Li et al., 2021 - ExpressHeart: Web Portal to Visualize Transcriptome Profiles of Non-Cardiomyocyte Cells
- Other Figures
- All Figure Page
- Back to All Figure Page
Figure 4
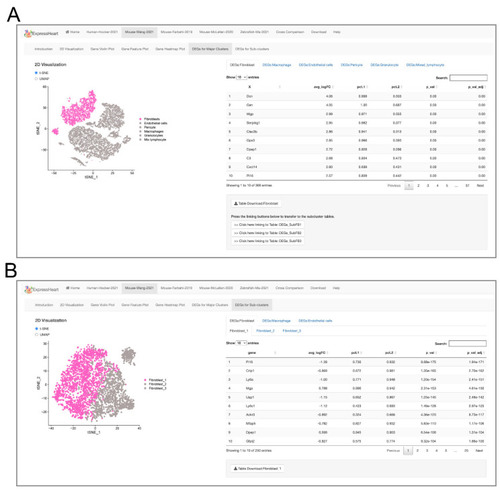
Interfaces of DEG lists for (A) each major cell type versus the other cell types, and (B) each subtype versus the other subtypes the same major cell type. On the left panel of each interface, the UMAP/t-SNE plot highlighting the target major cell type (A) or subtype (B) is presented, and the corresponding DEGs are listed in a table on the right. |
Expression Data
Expression Detail
Antibody Labeling
Phenotype Data
Phenotype Detail
Acknowledgments
This image is the copyrighted work of the attributed author or publisher, and
ZFIN has permission only to display this image to its users.
Additional permissions should be obtained from the applicable author or publisher of the image.
Full text @ Int. J. Mol. Sci.