
Figure 1
- ID
- ZDB-FIG-210902-130
- Publication
- Li et al., 2021 - ExpressHeart: Web Portal to Visualize Transcriptome Profiles of Non-Cardiomyocyte Cells
- Other Figures
- All Figure Page
- Back to All Figure Page
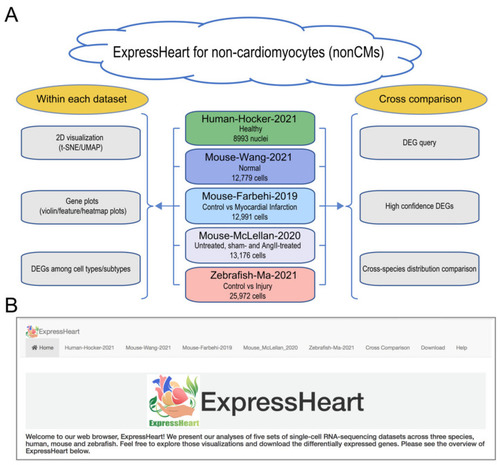
Overview of ExpressHeart. (A) Framework and (B) interface of ExpressHeart. ExpressHeart contains five scRNA-seq or snRNA-seq datasets (middle of panel A). These datasets are named by the last name of the first author, species, and the year of the corresponding publication or data release. The conditions and numbers of cells/nuclei are also presented in each dataset. On the left of panel A, we show three types of visualization and/or analysis within each dataset, including 2D visualization, gene plots via violin/feature/heatmap, and DEGs among cell types/subtypes. On the right of panel A, we show three types of visualization and/or analyses across different datasets. We provide a module (“Cross-comparison”) for DEG query across all datasets, where we report high confidence DEGs across multiple datasets within the same species for major cell types and compare homolog gene distribution across different species. Panel B shows the interface of the web portal. Each dataset has its own analysis and visualization module, using the same names specified in panel A. “Cross-comparison” module corresponds to three sub-modules showed in the right of panel A. |