|
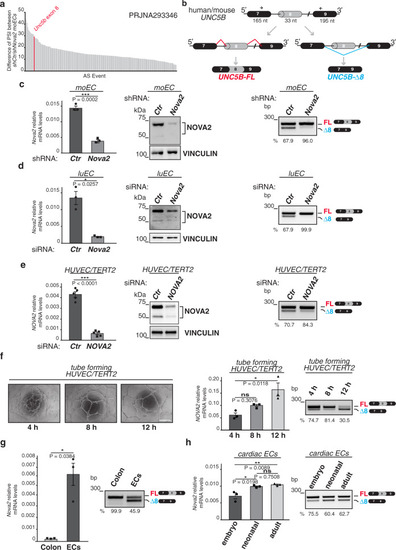
Inclusion of <italic>UNC5B</italic> exon 8 is regulated in ECs.a Differentially spliced exonic events in NOVA2-depleted moEC compared to control moEC (NCBI BioProject: PRJNA293346). Absolute difference of Percent Spliced-In (PSI) between means is shown. Unc5b exon 8 AS event is indicated in red. b Schematic representation of the mouse and human UNC5B genomic region with the AS exon 8 of 33 nt (gray). Black boxes = constitutive exons; lines = introns. Two different mRNAs result from the inclusion (red lines) or skipping (blue lines) of exon 8. Arrows indicate primers used for RT-PCR. c Left: RT-qPCR (relative to Ubb) and immunoblotting of NOVA2 expression levels in NOVA2-depleted moEC. The anti-NOVA2-specific antibody recognizes two immunoreactive bands at 50–55 kDa and 70–80 kDa, as previously reported27, 31; VINCULIN as loading control. Right: RT-PCR of Unc5b exon 8 AS profile in the above ECs. n = 3. dNova2 mRNA (relative to mouse Ubb or human ACTB) and protein expression levels, and AS analysis of Unc5b exon 8 in another murine EC line (luEC) (n = 3) and e in human immortalized ECs (HUVEC/TERT2) transfected with a siRNA against Nova2 or with a control siRNA. VINCULIN as loading control. n = 5. f Left: in vitro angiogenesis assay of HUVEC/TERT2 plated on Matrigel-coated plates. Scale bar: 0.5 mm. Right: NOVA2 mRNA expression levels (relative to B2M) and UNC5B exon 8 AS during differentiation of HUVEC/TERT2 and formation of capillary tube-like structures on Matrigel. h = hours after seeding. n = 3. g Analysis, by RT-qPCR, of Nova2 mRNA expression levels (relative to Ubb) and, by RT-PCR, of Unc5b exon 8 splicing in freshly purified ECs from mouse lung and colon tissue. n = 3. hNova2 mRNA expression levels (relative to Ubb) and Unc5b exon 8 AS in primary ECs from mouse hearth (cardiac ECs) at different developmental stages: embryonic (E16–E18); neonatal (P0-P1); adult (P60). n = 3. The percentage of exon inclusion is shown under each gel. n = biologically independent experiments. Two-tailed Student’s t-test or one-way ANOVA for multiple comparisons; Error bars indicate ±SEM. Exact P values are indicated: *P < 0.05; **P < 0.01; ***P < 0.001; ns not significant.
|