
Fig. 1
- ID
- ZDB-IMAGE-210902-30
- Publication
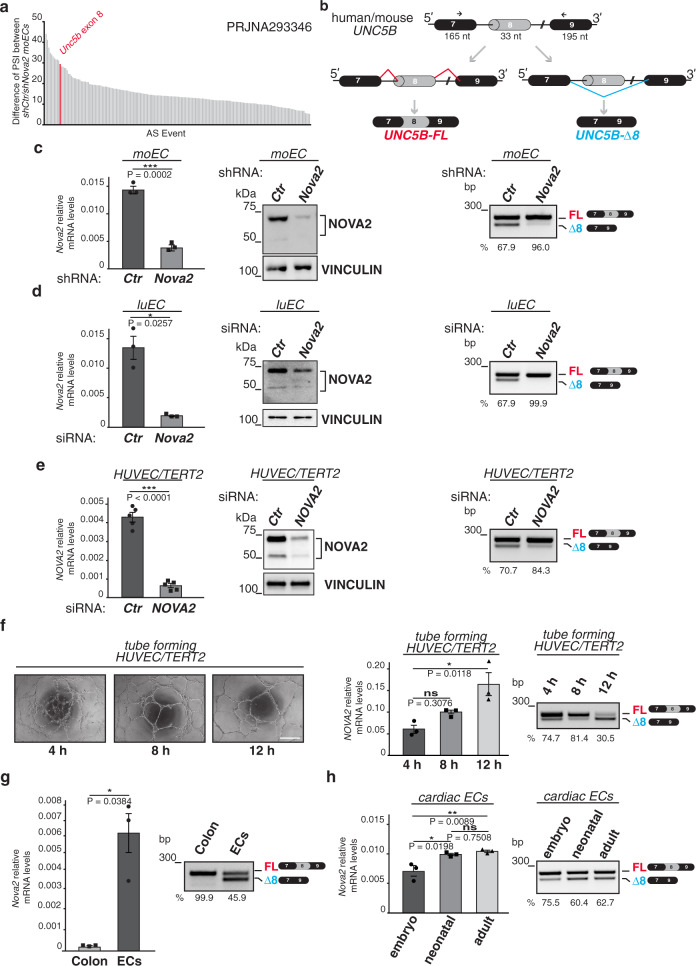
- Pradella et al., 2021 - A ligand-insensitive UNC5B splicing isoform regulates angiogenesis by promoting apoptosis
- All Figures
- Figures for Pradella et al., 2021
|
Fig. 1