
Figure 9
- ID
- ZDB-FIG-210902-218
- Publication
- Hentig et al., 2021 - Zebrafish Blunt-Force TBI Induces Heterogenous Injury Pathologies That Mimic Human TBI and Responds with Sonic Hedgehog-Dependent Cell Proliferation across the Neuroaxis
- Other Figures
- All Figure Page
- Back to All Figure Page
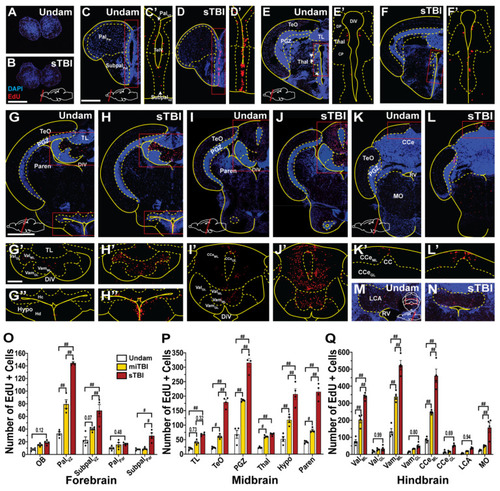
Injury-induced proliferation across the neuroaxis is region-specific and severity-dependent. (A–N) Coronal brain sections of undamaged and sTBI fish from the rostral aspect of the olfactory bulb to the caudal aspect of the lobus caudalis cerebelli. Red boxed regions in (C–L) are shown across the midline at a higher magnification in the corresponding prime and double prime panels. (O–Q) Quantification of the number of EdU-positive cells in brain subregions in undamaged, miTBI, and sTBI fish (n = 4). Solid lines in (A–N) denote tissue boundary, while dotted lines denote internal anatomical boundaries. Central posterior thalamic region, CP, corpus cerebelli, CCe, granule cell layer of corpus cerebelli, CCeGL, molecular layer of corpus cerebelli, CCeML, diencephalic ventricle, DiV, dorsal posterior thalamic region, DP, lobus caudalis cerebelli, LCA, medulla oblongata, MO, olfactory bulbs, OB, parenchyma of pallium, PalPar, ventricular/subventricular zone of pallium, PalVZ, parenchyma of midbrain, Paren, periventricular grey zone of tectum optic, PGZ, rhombencephalic ventricle, RV, telencephalic ventricle, TeV, optic tectum, TeO, thalamus, Thal, torus longitudinalis, TL, parenchyma of subpallium, SubpalPar, ventricular/subventricular zone of subpallium, SubpalVZ, granule cell layer of lateral valvula cerebelli, ValGL, molecular layer of lateral valvula cerebelli, ValML, granule cell layer of medial valvula cerebelli, VamGL, molecular layer of medial valvula cerebelli, VamML. Scale bars: (B) = 100 µm, for panels (A–C) = 200 µm, for panels (C–F’,G) = 500 µm, for panels (G–L,G’) = 200 µm, for panels (G’–L’,M,N). Mean ± SEM is depicted in (O–Q). Statistical analyses were performed with a Two-way ANOVA followed by a Sidik’s multiple comparison test. # p < 0.05, ## p < 0.01. |