
FIGURE
Fig. 2
- ID
- ZDB-FIG-210809-2
- Publication
- Ericsson et al., 2021 - Molecular and culture-based assessment of the microbiome in a zebrafish (Danio rerio) housing system during set-up and equilibration
- Other Figures
- All Figure Page
- Back to All Figure Page
Fig. 2
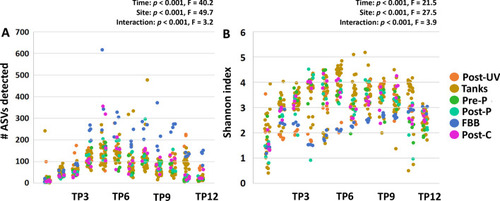
Richness and diversity of the system microbiome plateaus by approximately four weeks post-population. Dot plots showing the detected richness ( |
Expression Data
Expression Detail
Antibody Labeling
Phenotype Data
Phenotype Detail
Acknowledgments
This image is the copyrighted work of the attributed author or publisher, and
ZFIN has permission only to display this image to its users.
Additional permissions should be obtained from the applicable author or publisher of the image.
Full text @ Anim Microbiome