
Image
|
Figure Caption
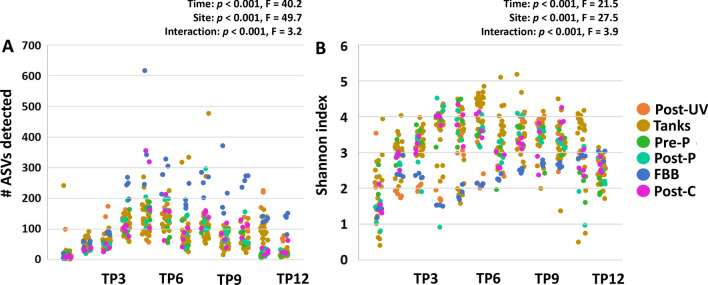
Fig. 2
Richness and diversity of the system microbiome plateaus by approximately four weeks post-population. Dot plots showing the detected richness (
Acknowledgments
This image is the copyrighted work of the attributed author or publisher, and
ZFIN has permission only to display this image to its users.
Additional permissions should be obtained from the applicable author or publisher of the image.
Full text @ Anim Microbiome