|
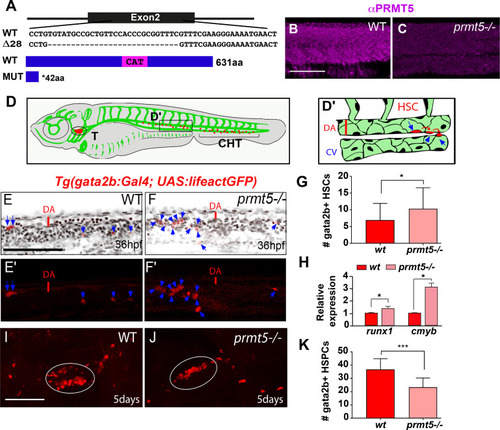
Loss of <italic toggle='yes'>prmt5</italic> affect HSCs and HSPCs production.(A) Schematic representation of the sequence targeted by CRISPR/Cas9 leading to a 28 nucleotides deletion, and of wild type and truncated Prmt5 proteins. The catalytic domain “CAT” appears in magenta. (B, C) Confocal sections of immunostaining with anti-Prmt5 antibody of wild type and prmt5 mutant embryos at 24 hpf. Scale bar 100 μm. (D) Schematic representation of vascular (green) and hematopoietic (red) systems in a zebrafish larva. Circle and bracket indicate the Thymus (T) and the Caudal Hematopoietic Tissue (CHT), respectively. (D’) Close-up of the trunk vasculature where HSCs emerge from the ventral wall of the dorsal aorta (DA), bud and migrate. Red line represents the diameter of the dorsal aorta. Cardinal Vein (CV). (E-F’) Confocal projections of transgenic Tg(gata2b:Gal4; UAS:lifeactGFP) embryos at 36 hpf showing gata2b+ cells in red and TO-PRO-3 (cell nuclei) in black. Blue arrows indicate HSCs labelled in red in wild type (E, E’) and in prmt5 mutant (F, F’) embryos. Scale bar 100 μm. (G) Average number of HSCs enumerated per confocal stack in wild type and in prmt5 mutant embryos at 36 hpf. Data are from 3 independent experiments with at least 6 individuals per experiment and a Mann-Whitney test was performed. (H) Relative mRNA expressions determined by RT-qPCR in the trunk of 36 hpf wild type and prmt5 mutant embryos, from 3 independent experiments with at least 6 animals per condition. T-test was performed. (I, J) Confocal projections of wild type (I) and prmt5 mutant (J) thymus from transgenic Tg(gata2b:Gal4; UAS:lifeactGFP) embryos at 5 days. Thymus are delimited by a white circle. Scale bar 100 μm. (K) Average number of HSPCs enumerated per confocal stack in wild type and prmt5 mutant embryos at 5 days from 3 independent experiments with at least 5 individuals per analysis. T-test was performed. * P<0.05, ** P<0.01, ***P<0.001.
|