|
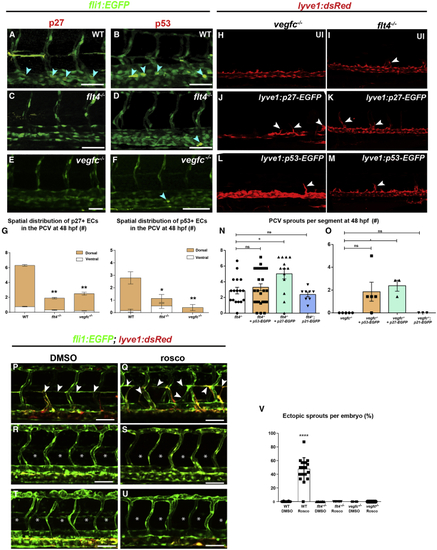
Cell-cycle arrest in dorsal PCV ECs is VegfC/VegfR3 dependent (A–F) Confocal images of 48-hpf WT (A and B), flt4−/− (C and D), and vegfc−/− (E and F); Tg(fli1:EGFP) embryos, stained with p27 (A, C, and E) or p53 (B, D, and F) antibodies. Light-blue arrowheads point to immunostained ECs, and co-localization channel is shown in yellow. (G) Number and spatial distribution of p27- and p53-stained ECs, in the PCV of WT, flt4−/−, and vegfc−/−; Tg(fli1:EGFP) embryos (np27 wt = 19, np27flt4−/− = 8, np27 vegfc−/− = 10, np53 WT = 17, np53flt4−/− = 15, np53vegfc−/− = 5). Statistical analysis was performed using one-way ANOVA followed by Tukey’s multiple comparisons test. (H–M) Confocal images of 48-hpf vegfc−/− (H, J, and L) and flt4−/− (I, K, and M); Tg(lyve1b:dsRed2) embryos, uninjected (H and I, nvegfc−/− = 5, nflt4−/− = 17) or injected with lyve1:p27-EGFP (J and K) or lyve1:p53-EGFP (L and M). White arrowheads point to PCV emerging sprouts. (N) Number of ectopic sprouts per segment in flt4−/−;Tg(lyve1b:dsRed2) embryos injected with lyve1:p27-EGFP (n = 13) or lyve1:p53-EGFP (n = 26) or stably expressing lyve1:p21-EGFP (n = 8). Statistical analysis was performed using Kruskal-Wallis followed by Dunnett's multiple comparisons test. (O) Number of ectopic sprouts per segment in vegfc−/−;Tg(lyve1b:dsRed2) embryos injected with lyve1:p27-EGFP (n = 3) or lyve1:p53-EGFP (n = 5) or stably expressing lyve1:p21-EGFP (n = 3). Statistical analysis was performed using Kruskal-Wallis followed by Dunnett's multiple comparisons test. (P–V) Confocal images of WT (P and Q), flt4−/− (R and S), and vegfc−/− (T and U); Tg(fli1:EGFP;lyve1b:dsRed2) embryos at 3 days post-fertilization (dpf), treated with DMSO (nWT = 24, nflt4−/− = 10, nvegfc−/− = 6) or roscovitine (nWT = 19, nflt4−/− = 8, nvegfc−/− = 10). Statistical analysis was performed using one-way ANOVA followed by Tukey’s multiple comparisons test. White arrowheads in (P) and (Q) point to normal and ectopic lymphovenous sprouts that are absent in flt4 and vegfc mutants (R–U, asterisks); quantified in (V). ∗p < 0.05, ∗∗∗p < 0.001, ∗∗∗∗p < 0.0001; ns, not significant. Scale bars: 70 μm.
|