
Figure 2.
- ID
- ZDB-FIG-210628-9
- Publication
- Sun et al., 2021 - Integrin intra-heterodimer affinity inversely correlates with integrin activatability
- Other Figures
- All Figure Page
- Back to All Figure Page
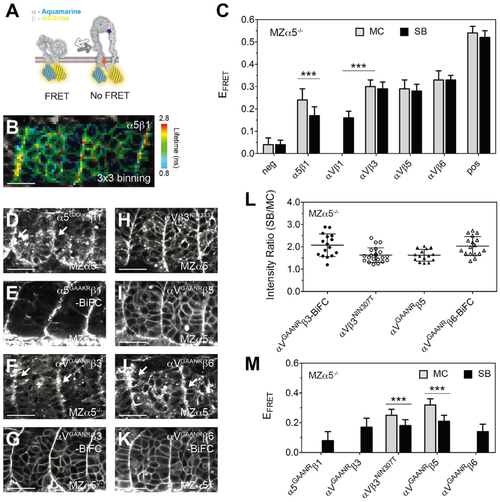
(A) Illustration of the FRET assay for the integrin conformation. The integrin α subunit cytoplasmic tail was tagged with Aqm as a FRET donor, and the β subunit was tagged with mCit as a FRET acceptor. When the cytoplasmic tails separate during integrin activation, FRET should be reduced. The locations of the αGAAXR mutations (orange star) and the β3NIN333T mutation (purple star) are indicated. (B) Heatmap of the fluorescence lifetime of integrin α5-Aqm co-expressed with β1-mCit (denoted α5β1). The raw image and lifetime distribution are shown in Figures S1C and S1D. Warm colors on the SB represent longer donor lifetimes, indicating weaker FRET and the active conformation. (C) FRET efficiency (EFRET) of different integrin heterodimers. Sample size is the same as in Figure 1M, except αVβ1, n = 20 measurements (12 embryos). (D–K) Activatable integrin alleles: α5GAAKR-Aqm co-expressed with β1-mCit (D), α5GAAKRβ1-BiFC (E), αVGAANR-Aqm co-expressed with β3-mCit (F), αVGAANRβ3-BiFC (G), αV-Aqm co-expressed with N-glycan wedge allele β3NIN333T-mCit (H), αVGAANR-Aqm co-expressed with β5-mCit (I), αVGAANR-Aqm co-expressed with β6-mCit (J), and αVGAANRβ6-BiFC (K). White arrows in (D), (F), and (J) indicate clustering on the somite border. Scale bars, 30 μm. (L) Clustering quantification of activatable integrin alleles by the SB/MC intensity ratio. αVGAANRβ3-BiFC, n = 16 (9 embryos); αVβ3NIN333T, n = 21 (15 embryos); αVGAANRβ5, n = 15 (8 embryos); αVGAANRβ6-BiFC, n = 17 (8 embryos). α5GAAKRβ1-BiFC clustering cannot be measured because of the poor membrane expression in the mesenchyme. (M) EFRET of activatable integrin alleles. Sample size is the same as in (L), except α5GAAKRβ1, n = 18 (9 embryos); αVGAANRβ3, n = 14 (9 embryos); and αVGAANRβ6, n = 15 (7 embryos). EFRET of αVβ1 (C), α5GAAKRβ1, αVGAANRβ3, and αVGAANRβ6 (M) cannot be measured in the MC because of the poor membrane expression. (C and M) Data are mean ± SD. ∗∗∗p < 0.0001, two-sided t test. All experiments are in MZα5−/− embryos. |