
Figure 4.
- ID
- ZDB-FIG-210628-11
- Publication
- Sun et al., 2021 - Integrin intra-heterodimer affinity inversely correlates with integrin activatability
- Other Figures
- All Figure Page
- Back to All Figure Page
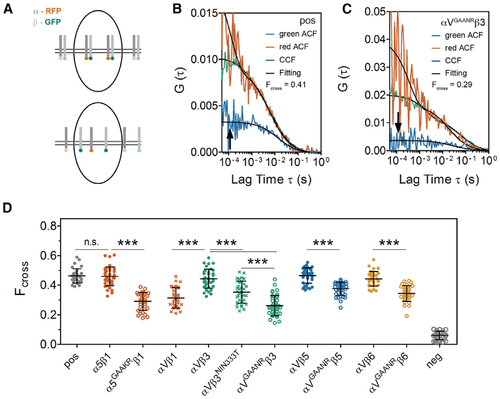
(A) Illustration of fluorescence cross-correlation spectroscopy (FCCS) measurements. The integrin α subunit cytoplasmic tail was tagged with RFP and the β subunit was tagged with GFP. When the two subunits move together through the confocal volume (upper panel), the green and red intensity fluctuations correlate, leading to a high cross-correlation curve (arrow in B); conversely, when the heterodimer subunits dissociate (lower panel), there is a lower cross-correlation curve (arrow in C). (B and C) FCCS measurements of the positive control (pos), which is a mem-GFP-RFP tandem fusion (B) and FCCS measure of αVGAANRβ3 (C). The auto-correlation functions (ACFs) for each channel are shown in red and green while the cross-correlation between the two channels is in blue. Data fitting is shown in black. Measurements were performed on the cell surface in somite MCs (white cross in Figure 1E). (D) Fcross of different integrin heterodimers calculated from FCCS. A lower Fcross indicates a weaker intra-heterodimer association. pos, positive control, mem-GFP-RFP tandem; neg, negative control, co-expression of mem-GFP and mem-RFP. Data are mean ± SD. ∗∗∗p < 0.0001, n.s., not significant (two-sided t test). |