|
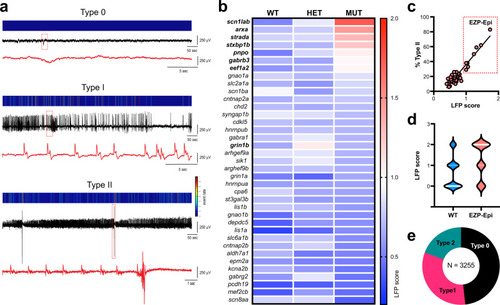
Electrophysiological screening of EZP lines.a LFP recordings representing type 0 (low voltage, small, or no membrane fluctuations), type I (low amplitude, sharp interictal-like waveforms), and type II (low frequency, sharp ictal-like waveforms with large-amplitude multi-spike events and post-ictal slowing) scoring activity. For each example, a color-coded event rate histogram, full 15 min LFP recording, and high-resolution LFP close-up (red box, red trace a) are shown. b Heatmap showing mean larval zebrafish LFP recording scores for all 37 EZP zebrafish lines ranked from highest homozygote score to lowest; N = 77–127 larvae per gene (see https://zebrafishproject.ucsf.edu for N values on each individual line). A threshold of a mean LFP score >1.0 was classified as an EZP line exhibiting epilepsy (indicated in bold font: scn1lab, arxa, strada, stxbp1b, pnpo, gabrb3, eef1a2, and grin1b). c Regression plot for all 37 mutants showing mean LFP score versus % of Type II larvae for each homozygote. Seven homozygote and one heterozygote lines highlighted in “EZP-epi” box as clearly differentiated from a cluster of 31 non-epileptic EZP lines with LFP scores <1.0. Simple linear regression R2 = 0.8790; ***Significant deviation from zero, p < 0.0001; DFn, DFd = 1, 36. d Violin plots of all LFP scores recorded for EZP epilepsy lines (N = 190) compared with all WT control siblings (N = 783 larvae). Note: type 2 epileptiform events were only observed in 14.7% of all WT larvae. e Distribution of Type 0, I, and II scores for all WT, heterozygote, and homozygote larvae screened by LFP recordings (N = 3255 larvae).
|