|
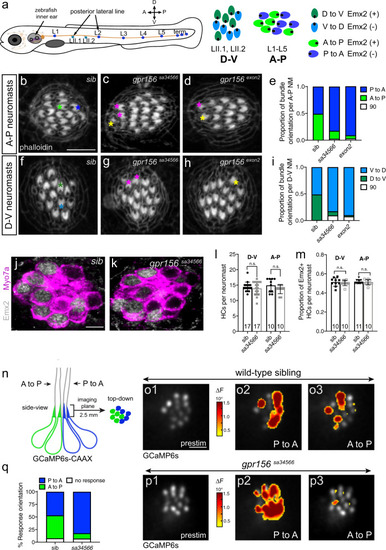
Gpr156 dictates hair cell orientation reversal and directional sensitivity in zebrafish neuromasts.a Schematic of the lateral-line system in a 5 day-post-fertilization zebrafish. Neuromast HCs show binary orientation along the antero-posterior (A–P) or dorso-ventral (D–V) axis as depicted. Emx2 is only expressed in HCs of one orientation in each neuromast (green D to V and A to P HCs). HC orientation is indicated by a black dot representing the off-center basal body. b–i Phalloidin labeling in neuromasts reveals HC orientation by the lack of signal above the off-center basal body. In wild-type siblings (b, e, f, i), neuromasts contain an equal proportion of HCs with either orientation. In gpr156 mutants (c–e, g–i), there are more P to A (c–e) and V to D (g–i)-oriented HCs compared to wild-type siblings (Tukey’s multiple comparison test, P to A exon2 allele p < 0.0001, sa34566 allele p < 0.0001; V to D exon2 allele p < 0.0001, sa34566 allele p < 0.0001). Green and blue asterisks highlight the two HC orientations in wild-type sibling neuromasts. Magenta and yellow asterisks highlight outlier HCs oriented 180° or 90° compared to the majority of HCs in gpr156 mutants. n = 10 neuromasts and N ≥ 8 animals per genotype, examined at 5 dpf. j, k Emx2 and Myo7a co-labeling in neuromasts. Wild-type siblings and gpr156 mutants neuromasts have a similar number of HCs (l) (mean ± SEM; unpaired t-test (two-tailed), A-P p = 0.1686; Mann–Whitney test (two-tailed), D-V p = 0.8547), and a similar proportion of HCs express Emx2 per neuromast (m) (mean ± SEM; unpaired t-test (two-tailed), A-P p = 0.5756; Mann–Whitney test (two-tailed), D-V p = 0.4805). In l–m the number of neuromasts (n) examined at 5 dpf in N ≥ 8 animals per genotype is indicated. n Scheme showing the GCaMP6s calcium reporter (blue and green) and the imaging plane in a neuromast. o1, p1 Baseline gray scale GCaMP6s images of the hair bundle imaging plane in wild-type siblings (o1) and gpr156 mutants (p1; sa34566 allele). o2, o3, p2, p3 Spatial patterns of GCaMP6s calcium signal increases in hair bundles during P to A (o2, p2) or A to P (o3, p3) directed fluid-jet stimulation. GCaMP6s signals are colorized according to the ∆F heat maps and superimposed onto prestimulus (prestim) baseline images (o1, p1). q In wild-type siblings, GCaMP6s signals are detected during both P to A and A to P directed stimulation (o2, o3). In contrast, compared to wild-type, in gpr156 mutants, significantly more hair bundles respond to P to A directed stimulation (p2–p3) (Sidak’s multiple comparison test, P to A p = 0.0008; n = 8 neuromasts per genotype and N = 4 wild-type and N = 3 mutant animals, examined at 5 dpf. See Supplementary Fig. 4 for individual HC responses). NM, neuromast; sib, wild-type sibling. Scale bars are 5 µm (b–d and f–h, j, k, o1–3, and p1–p3).
|