
Figure 1
- ID
- ZDB-FIG-210526-25
- Publication
- Tarashansky et al., 2021 - Mapping single-cell atlases throughout Metazoa unravels cell type evolution
- Other Figures
- All Figure Page
- Back to All Figure Page
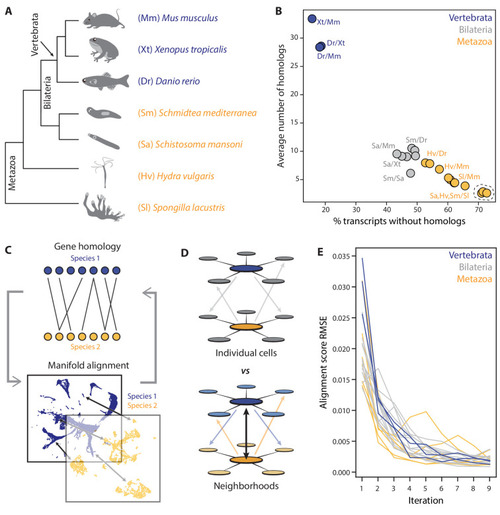
(A) Schematic showing the phylogenetic relationships among seven species analyzed. (B) Challenges in mapping single-cell transcriptomes. Gene duplications cause large numbers of homologs per gene, determined by reciprocal BLAST (cut-off: E-value <10−6), and frequent gene losses and the acquisition of new genes result in large fractions of transcriptomes lacking homology, which limits the amount of information comparable across species. (C) SAMap workflow. Homologous gene pairs initially weighted by protein sequence similarity are used to align the manifolds, low dimensional representations of the cell atlases. Gene-gene correlations calculated from the aligned manifolds are used to update the edge weights in the bipartite graph, which are then used to improve manifold alignment. (D) Mutual nearest neighborhoods improve the detection of cross-species mutual nearest neighbors by connecting cells that target one other’s within-species neighborhoods. (E) Convergence of SAMap is evaluated by the root mean square error (RMSE) of the alignment scores between mapped clusters in adjacent iterations for all 21 pairwise comparisons of the seven species. |