
Fig. 9
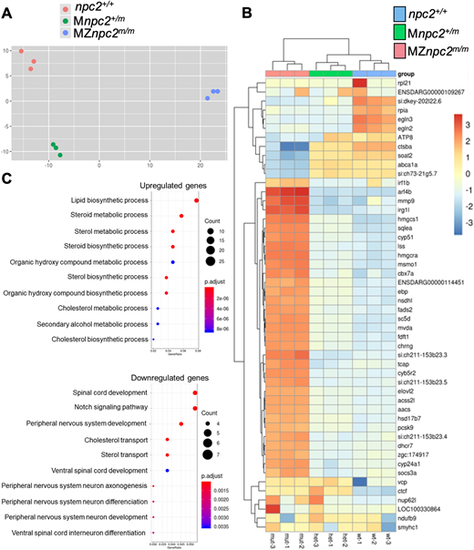
m/m (A) Principal component analysis (PCA) of each pool of mRNA from all three genotypes: npc2+/+, Mnpc2+/m and MZnpc2m/m. These data suggested that MZnpc2m/m transcriptomes differed more compared with npc2+/+ and Mnpc2+/m transcriptomes than npc2+/+ differed from Mnpc2+/m (x-axis: 67% of variance; y-axis: 14% of variance). (B) Heatmap of the top 50 genes with the most expression variation. The heatmap plots the deviation from the row mean. (C) Dotplot of GO biological process enrichment in genes differentially expressed between mutant and heterozygote. This represents highly enriched GO biological process terms from the analysis with the color corresponding to level of enrichment (adjusted P-value) and the size of the dots representing the number of genes associated with the GO term. |