
Fig. 3
- ID
- ZDB-FIG-210512-62
- Publication
- Martínez-Álvarez et al., 2021 - Uptake and effects of graphene oxide nanomaterials alone and in combination with polycyclic aromatic hydrocarbons in zebrafish
- Other Figures
- All Figure Page
- Back to All Figure Page
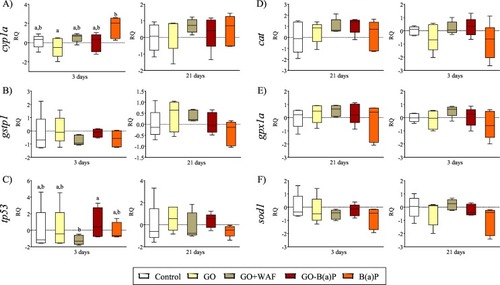
Relative quantification (RQ) of transcription levels of the biotransformation metabolism related genes A) cyp1a and B) gstp1, C) tumour suppressor gene tp53 and oxidative stress related genes D) cat, E) gpx1a and F) sod1 in adult zebrafish liver after 3 and 21 days of exposure to GO, GO + WAF, GO-B(a)P and B(a)P. Box-plot boxes represent the percentage data values in between the 25th and the 75th percentile, median indicated by a line in the middle of the box. Whiskers are the data values in up to the 5th percentile and 95th percentile. Different letters indicate statistically significant differences (p < 0.05) within each sampling time according to the Kruskal-Wallis test followed by C, E) the post hoc Dunn's test for non-parametric data and to A, B, D, F) one-way ANOVA followed by the post hoc Tukey's test. |