
- Title
-
Uptake and effects of graphene oxide nanomaterials alone and in combination with polycyclic aromatic hydrocarbons in zebrafish
- Authors
- Martínez-Álvarez, I., Le Menach, K., Devier, M.H., Barbarin, I., Tomovska, R., Cajaraville, M.P., Budzinski, H., Orbea, A.
- Source
- Full text @ Sci. Total Environ.
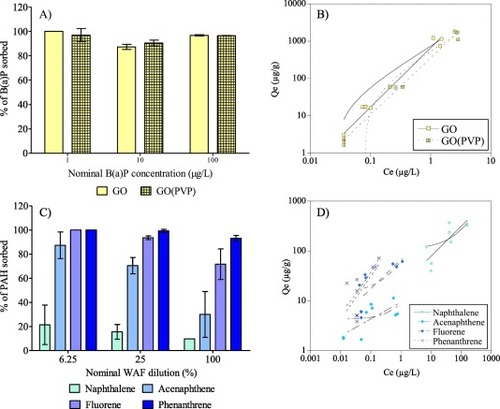
A) Percentage of B(a)P sorbed to GO and to GO(PVP) for the three nominal incubation concentrations, and B) their corresponding sorption isotherms. C) Percentage of PAHs from WAF sorbed to GO for WAF dilutions tested, and D) their corresponding sorption isotherms. Lines represent isotherms fitted by the Linear (curved line) and Freundlich model (straight line). |

Localisation of GO in adult zebrafish intestine. Micrographs of histological sections of A) unexposed adult zebrafish at 21 days showing normal intestine histology and remnants of brine shrimp capsules in the lumen; B) adult zebrafish exposed to 2 mg/L of GO for 21 days; C) adult zebrafish exposed to 2 mg/L of GO + WAF for 21 days; D) adult zebrafish exposed to 2 mg/L of GO-B(a)P for 21 days. Fish exposed to treatments containing GO showed abundant putative GO platelets in the lumen of the intestine (arrows). E–F) TEM micrographs showing the apical zone of the enterocytes of adult zebrafish after 21 days of exposure to 2 mg/L GO. The presence of GO platelets (arrows) was detected in the digestive lumen, but not inside enterocytes. Microvilli (mv), mitochondria (mc). Scale bars: A–D) 100 μm, E) 0.5 μm and F) 2 μm. |
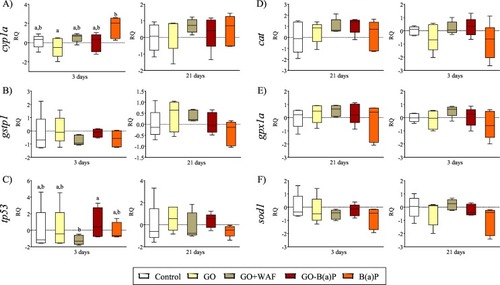
Relative quantification (RQ) of transcription levels of the biotransformation metabolism related genes A) cyp1a and B) gstp1, C) tumour suppressor gene tp53 and oxidative stress related genes D) cat, E) gpx1a and F) sod1 in adult zebrafish liver after 3 and 21 days of exposure to GO, GO + WAF, GO-B(a)P and B(a)P. Box-plot boxes represent the percentage data values in between the 25th and the 75th percentile, median indicated by a line in the middle of the box. Whiskers are the data values in up to the 5th percentile and 95th percentile. Different letters indicate statistically significant differences (p < 0.05) within each sampling time according to the Kruskal-Wallis test followed by C, E) the post hoc Dunn's test for non-parametric data and to A, B, D, F) one-way ANOVA followed by the post hoc Tukey's test. |

Results of the biochemical biomarkers measured in adult zebrafish after 3 and 21 days of exposure to GO, GO + WAF, GO-B(a)P and B(a)P. A) EROD activity in liver and B) gills, C) GST activity in liver and D) gills, E) CAT activity in liver and F) gills and G) AChE activity in brain. Different letters indicate statistically significant differences (p < 0.05) within each sampling time according to A, B, C, E, G) the Kruskal-Wallis test followed by the post hoc Dunn's test for non-parametric data and D, F) one-way ANOVA followed by the post hoc Tukey's test for parametric data. Asterisks indicate statistically significant differences (p < 0.05) for the same treatment between exposure days according to the Mann-Whitney's U test for non-parametric data and Student's t-test for parametric data. |

Micrographs of histological sections of zebrafish liver and gills. A) Liver of unexposed adult zebrafish at 21 days showing normal morphology; B) Liver of zebrafish exposed to GO for 3 days showing liver vacuolisation; C) Liver of a zebrafish exposed to GO + WAF for 21 days showing megalocytosis (black arrow); D) Liver of a zebrafish exposed to GO-B(a)P for 21 days showing liver vacuolisation; E) Gills of unexposed adult zebrafish at 3 days showing normal morphology; F) Gills of zebrafish exposed to GO for 3 days, showing aneurisms (asterisks) of the secondary lamellae; G) Gills of a zebrafish exposed to GO + WAF for 3 days, showing inflammation (arrow head); H) Gills of a zebrafish exposed to GO-B(a)P for 3 days, showing inflammation (arrow head) and aneurisms (asterisks) of the secondary lamellae. Scale bars: A–D) 100 μm, G) 50 μm and E, F, H) 25 μm. |