
Fig. 2
- ID
- ZDB-FIG-210510-26
- Publication
- Zhang et al., 2020 - Bone morphogenetic protein signaling regulates Id1-mediated neural stem cell quiescence in the adult zebrafish brain via a phylogenetically conserved enhancer module
- Other Figures
- All Figure Page
- Back to All Figure Page
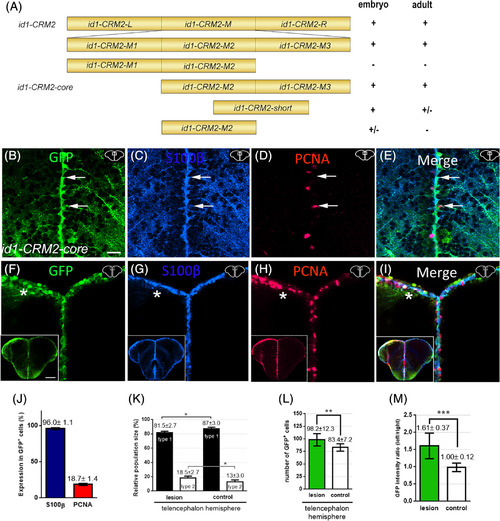
Deletion mapping of id1‐CRM2 identified a 157 bp core region, which confers RGC‐specific expression in the adult telencephalon. A, 5′and 3′ deletions of id1‐CRM2 analyzed for expression in zebrafish embryos and adult brains. Results are summarized on the right; + indicates specific GFP expression; ± and − represent weak and absence of expression, respectively. B‐I, Immunohistochemistry of telencephalic transverse sections with antibodies against GFP (B, F), S100ß (C, G), and PCNA (D, H) (merged panels: E, I). Section levels and areas of magnification are indicated in the upper right‐hand corner of each image. B‐E, White arrows show two RGCs. E, The upper cell is GFP+/S100β+/PCNA− (type 1 RGC), whereas the lower cell is GFP+/S100+/PCNA+ (type 2 RGC). F‐I, Upon stab wound injury the reporter construct expression is upregulated. The left injured side is labeled with a white asterisk. B‐I, Section levels and areas of magnification are indicated in the upper right‐hand corner each image. J, Quantification of PCNA and S100ß expression in id1‐CRM2:GFP‐positive cells. K, Relative population size of type 1 and type 2 RGCs in the control and lesioned hemisphere. L, M, Quantification of GFP‐positive cells and GFP intensity upon injury. Graphs showing the number of GFP‐expressing cells (L) and the intensity ratio between left uninjured (control) and right injured hemispheres respectively (M). Bars: mean ± SD. Significance is indicated by asterisks: *P < .05; **P < .01; ***P < .001. Boxed image in lower left‐hand corner of (F‐I) represents entire brain sections. n = 3 animals (B‐L), n = 15 sections (M). Scale bar = 20 μm (B‐I); 200 μm for Boxed image in lower left‐hand corner of (F‐I) |