|
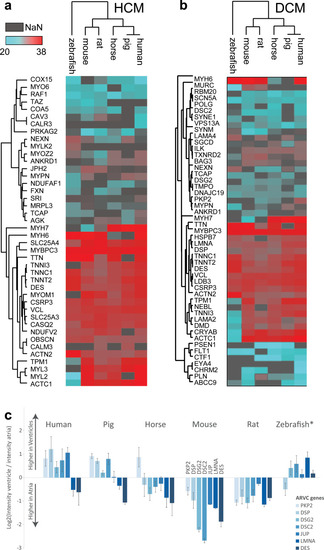
Protein abundance profiles for cardiac disease–associated proteins across species.(a, b) Median protein abundances in LVs are shown for proteins reported to be involved in HCM (panel a) and DCM (panel b) across species. Color scale represents log2-transformed protein intensities (red: highest abundance, turquoise: lowest abundance, and gray: not available). (c) Comparison of protein abundance ratios between atria and ventricle for proteins encoded by 7 genes involved in ARVC. log2 fold change between ventricle and atria are shown. Note that the human ratio profile is best reflected by pig, while profiles in other species differ markedly. Bar height denotes the sample mean, and error bars denote standard deviation. This analysis is based on data presented in S8 Table. ARVC, arrhythmogenic right ventricular cardiomyopathy; DCM, dilated cardiomyopathy; HCM, hypertrophic cardiomyopathy; LV, left ventricle.
|