|
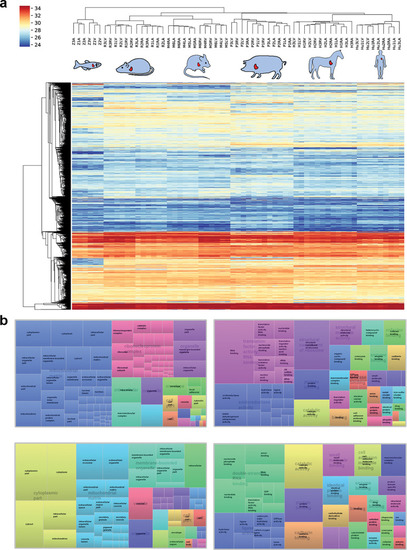
Protein abundance profiles across species.(a) Unsupervised hierarchical clustering of normalized protein intensities, for proteins measured in all samples resulted in grouping of samples from the same organism and reflects evolutionary distance between species as well as specific similarities and differences in protein expression. Proteins are colored by intensity with red showing highest and blue showing lowest intensity values (color bar denotes log2-transformed normalized protein intensities). (b) Visual representation of GO enrichment analysis of proteins with significantly different (upper panel) or similar (lower panel) abundance profiles across all species. Shown are representative enriched terms for GO, BP, CC, and MF, as well as KEGG pathways. Sizes of boxes are proportional to −log10 (p-value) of the enrichment (the larger, the more significant), and numbers denote the number of proteins enriched in the respective category. BP, biological process; CC, cellular component; GO, gene ontology; KEGG, Kyoto Encyclopedia of Genes and Genomes; MF, molecular function.
|