
Figure 4
- ID
- ZDB-FIG-210503-125
- Publication
- Lai et al., 2021 - The Great Capacity on Promoting Melanogenesis of Three Compatible Components in Vernonia anthelmintica (L.) Willd.
- Other Figures
- All Figure Page
- Back to All Figure Page
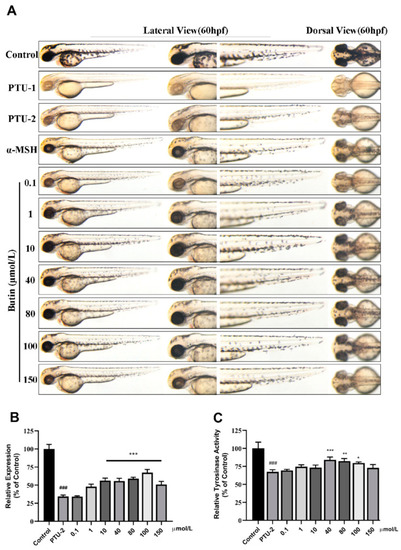
Effect of butin on melanogenesis in vivo. (A) Zebrafish melanin phenotype in various concentrations of butin [0.1, 1, 10, 40, 80, 100 and 150] μmol·L−1, the α-MSH is 60 μmol·L−1, and the PTU-1 group was not washed at all while the PTU-2 group was washed before administration. The control, PTU-1, PTU-2 and α-MSH groups share with caffeic acid and luteolin. (B) Collecting zebrafish in each group for testing melanin content (relative expression % of control). (C) Tyrosinase activity in zebrafish exposure to butin for 24 h. In (B,C), results shown are mean ± SEM. Data were analyzed by ANOVA followed by post hoc Tukey test. n = 30 zebrafish, ### p<0.001 vs. Control, *** p < 0.001, ** p < 0.01, * p < 0.05 vs. PTU-2. |