
Fig. 7
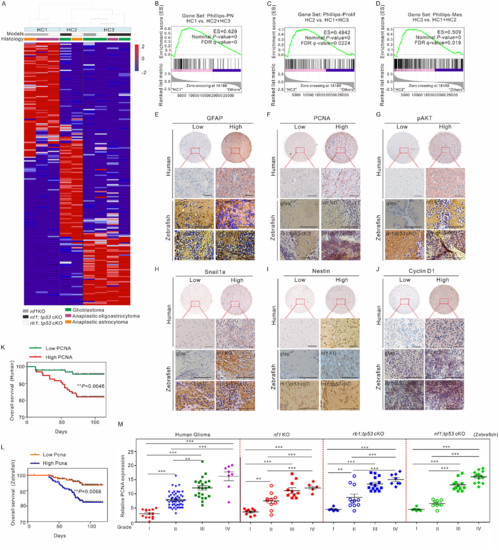
Molecular, histological, and prognostic comparison between zebrafish and human gliomas. (A) The global transcriptome of gliomas generated in nf1 KO (grey bars), nf1;tp53 cKO (black bars), and rb1;tp53 cKO (white bars) fish were analysed by unsupervised hierarchical clustering (HC). The results showed the differential expression levels based on the median absolute deviation scores. Three primary clusters, HC1–3, and their dendrograms were shown at the top of the image. The heat map illustrated the most upregulated probe sets in each cluster derived using a linear model algorithm. The primary histological features were indicated with glioblastoma (green bars), anaplastic oligoastrocytoma (purple bars), and anaplastic astrocytoma (orange bars). (B–D) GSEA enrichment plots were drawn to compare each primary cluster with the other two clusters using three gene sets that define the expression subgroups of human gliomas, namely, Phillips-PN (proneural; B), Phillips-Prolif (proliferative; C), and Phillips-Mes (mesenchymal; D) subgroups. (E–J) Representative images obtained from the histological examination of the expression of several key gliomagenesis-relevant factors, including GFAP, PCNA, pAKT, Snail1a, Nestin, and Cyclin D1, in gliomas formed in human and zebrafish with different mutations (gfapWT, nf1 KO, rb1;tp53 cKO, and nf1;tp53 cKO fish). Scale bars = 100 μm. (K and L) Correlation between prognoses and Pcna expression in brain harboured tumours in humans (n = 97; K) and nf1 KO fish (n = 100; L). (M) Correlation between glioma malignancy (grades I to IV) and PCNA expression in humans (n = 97), nf1 KO (n = 34), rb1;tp53 cKO (n = 40), and nf1;tp53 cKO fish (n = 39). Data shown as mean ± SEM. **P < 0.01, ***P < 0.001. |