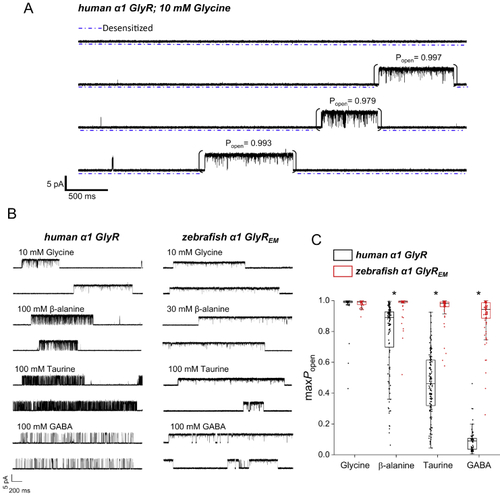
Single-channel recordings show that agonists are more efficacious on zebrafishα1 GlyREMcompared with human GlyRα1.A, example of a cell-attached single-channel recording from human α1 GlyR activated by 10 mm glycine in the recording electrode. Three clusters of single-channel activity are separated by long desensitized intervals (dashed lines under the trace). Popen values shown above each cluster were obtained as ratios between cluster open time and cluster duration. Long desensitized intervals were not included in the analysis. B, single-channel activity evoked by saturating concentrations of glycine, β-alanine, taurine, and GABA for human α1 GlyR (left panel) and zebrafish α1 GlyREM (right panel). C, boxplot showing maximum Popen of glycine, β-alanine, taurine, and GABA for human α1 GlyR (black, left hand side in each pair) and zebrafish α1 GlyREM (red, right hand side). Each point is a Popen value obtained from a cluster of single-channel activity in the presence of 10 mm glycine, 100 mmβ-alanine, 100 mm taurine, or 100 mm GABA. Boxes show the 25th and 75th percentiles, and whiskers the furthest points that fall within 1.5 times of the interquartile range from the 25th to 75th percentiles. The horizontal line in each box shows the median. Asterisks denote significant differences in randomization tests, two-tail, unpaired; 10,000 iterations p < 0.005.
|
