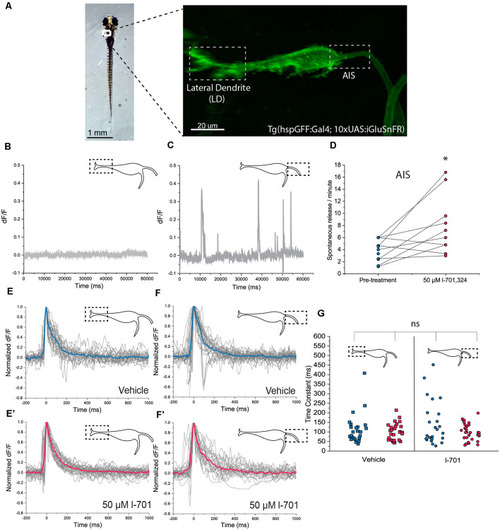
In vivo detection of glutamate-release on the M-cell by iGluSnFR. (A) Representative image of a transgenic Tg(hspgGFF62A:Gal4; 10xUAS:iGluSnFR) fish (6 dpf) in the M-cell region (dorsal view, anterior on top). As previously described, the M-cell receives two major glutamatergic inputs: direct connections from the VIII. nerve ends on the lateral dendrite (left gray box) while inputs coming from a feedforward excitatory network form the axon cap surrounding the AIS of the M-cell (right gray box). (B,C) Examples of a 1-min line-scans detecting spontaneous glutamate-release and revealing differences between the LD and the AIS using two-photon imaging. Spontaneous release was completely absent from the LD but was present in an infrequent and unordered fashion at the AIS, with an average of 2–4 releases/minute. (D) Administration of l-701 significantly increased the frequency of spontaneous glutamate-release at the AIS (each dot represents an average of three measurements, n = 12 fish, p = 0.02, paired sample t-test). (E,E’) The kinetic characteristics of the fluorescent signal after acoustic stimulation indicating glutamate release at the LD in the vehicle (n = 5 fish; five repetitions per fish) and 1–701 treated larvae (n = 6 fish; five repetitions per fish). (F,F’) The kinetic characteristics of the fluorescent signal after acoustic stimulation indicating glutamate release at the AIS in the vehicle (n = 5 fish; five repetitions per fish) and 1–701 treated larvae (n = 7 fish; five repetitions per fish). (G) Kinetic response curves were normalized and compared based on the time constant, which revealed no significant difference between the two regions of interest. Treatment with l-701 did not cause alterations in response dynamics either (five traces per fish, n = 5, 6, 5, 7, respectively, p = 0.77, one-way ANOVA). *p < 0.05; ns, not significant.
|
