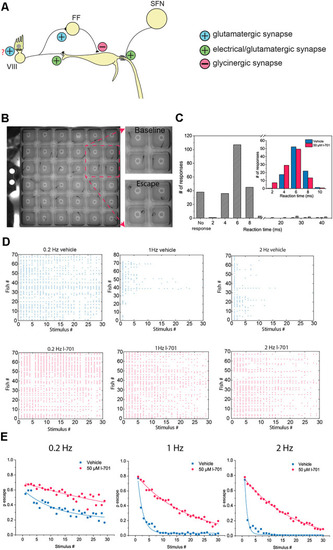
Characteristics of the M-cell mediated escape response, and its habituation. (A) Schematic representation of the startle circuit located in the hindbrain. The M-cell, a command neuron responsible for eliciting a startle response receive two excitatory inputs: VIII nerve inputs at the distal lateral dendrite (LD), and inputs from spiral fiber neurons (SFN) at the axon initial segment (AIS) via a feedforward excitatory circuit. Additionally, the M-cell is innervated by a glycinergic feedforward inhibitory circuit converging on the soma of the M-cell. (B) Representative image of an M-cell mediated escape response. Fish were placed in individual wells on a 6 × 6 custom plate with a speaker underneath delivering acoustic-vibrational stimuli. A high-speed camera set up above the plate was used to record the behavior. (C) Histogram showing the latency of observed escape responses. M-cell mediated escapes, often referred to as short-latency C-bends (SLC) are elicited approximately 2–12 ms after stimulus onset. Longer latency escape responses are mediated by neural circuits other than the M-cell. With our stimulus-delivery approach, the most frequently observed escapes happened 4–8 ms after the stimulus, consistent with the time window the M-cell operates in. Longer latency escapes were rarely observed. Latencies were manually calculated. Two-hundred and forty-three responses of 81 fish were measured. Inset: Fish treated with either 50 μM l-701 or vehicle show no significant difference in their distribution of response latency values ( n = 95, 100 responses from 19, 20 fish, p = 0.09, Kolmogorov–Smirnov Test). (D) Repetitive acoustic-vibrational stimulation using the 6 × 6 plate causes a progressive decline in escape responses. This decline is dependent on the frequency of the stimulation, with higher frequencies causing more rapid habituation. Ninety-min incubation in 50 μM l-701 greatly disrupts the habituation of the escape response (vehicle: n = 70, 80, and 70 for 0.2 Hz, 1 Hz, and 2 Hz, respectively; l-701: n = 70, 70 and 70 for 0.2 Hz, 1 Hz and 2 Hz, respectively). (E) Plotting the probability of an escape response at each time point during the stimulation based on averages from all fish, exponential fit used.
|
